On the C++ team we’ve heard loud and clear from users that build times are a pain point. So we’ve continued our focus on improving the step, linking, that dominates F5 build times. Fast F5 build times, or iteration build times, are a key contributor to developer productivity and we felt that there was a large opportunity so we narrowed in on changes that we felt could move the needle 2x or more. This is on top of the significant improvements we made to the tool chain to speed up link times in the VS 2019 16.0 release. Let me give a teaser of the kinds of wins we were able to achieve.

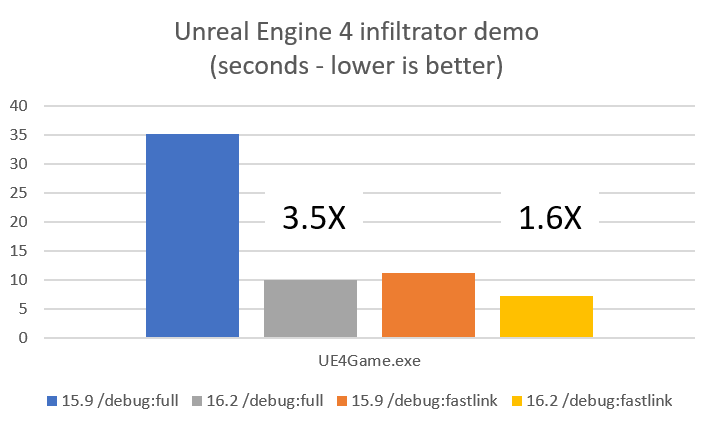
This shows a 3.5X win in 16.2 vs. 15.9 for a /debug:full build of the release configuration of the UE4 infiltrator demo and a 1.6X win using /debug:fastlink. This is a middle of the road win given the other workloads we measured. The fastlink win in particular was a little weak. So what did we do? We went back to basics.
What did we do: Improved Fundamentals
Link.exe is responsible for combining a disparate and large set of data into the executable and PDB and is fundamentally a serial process (mostly). After our changes in VS2019 16.0 to reduce the size of the debug input, as well as improvements to our type hashing strategy, we went back to basics and improved our core data structure and algorithm implementations. With this change all our internal data structures have been updated to give better cache performance and memory utilization, as well as implement aggressive memoization of intermediate data to eliminate redundant computation. These changes are at the base of the linker and the entire C++ ecosystem and, happily, show wins across nearly all the scenarios we track. Do you use /debug:full? It’s faster. Do you use /debug:fastlink? It’s faster too. Additionally, recompile scenarios that use link /incremental also follow the trend and are faster as well.
A key objective with these changes, as with any changes we make to the MSVC toolset, was to maintain compatibility. All of the changes we made preserved interoperability so if you have an older library or PDB that is binary compatible with VS everything will continue to work.
Show me the numbers
One of our key outcomes we wanted from this effort was to improve iteration build times for our largest inputs. These typically are large dlls or exes that combine a large number of objs with static libs and other components. There are a lot of places where project sizes get big, but there were two main areas where we found good examples to analyze and improve.
Open Source Projects
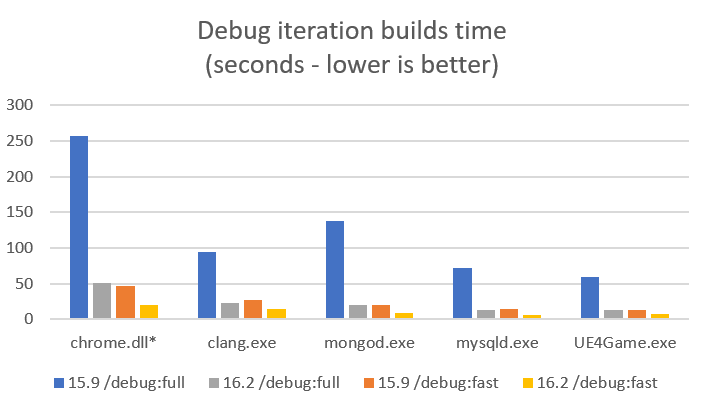
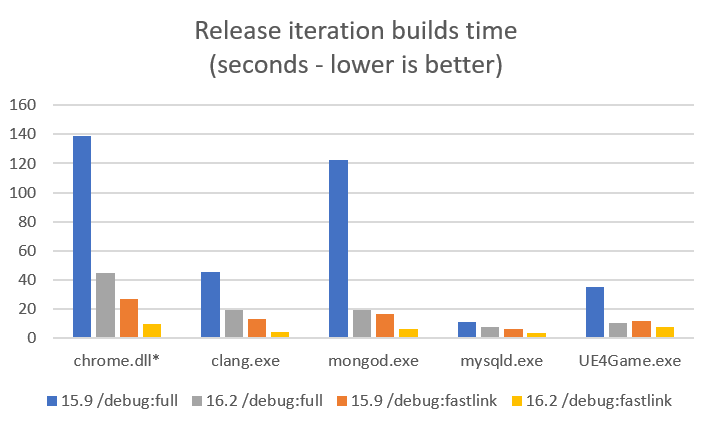
There are several large OSS projects that we track for general correctness representative of long link times. For each of the workloads below we looked through the builds and found the link command that took the most time, and then created a link repro for it. To model the single obj rebuild and link time each of these link repros were then run in isolation. The times below are for each of the individual link repros and show the comparison between VS 2017 15.9 and VS 2019 16.2 Preview 2 “all up”. Note: the tables are split out into one for Debug time as well as one for Release with debug info time, also a description of /debug:fastlink is available on the VC blog.


These are the links to the source of the workloads we used in the above experiments.
- Chrome (commit 2a88e68bd7498b185675098bcd0addf2c7b7808 ) * this is an older time stamp that still builds with MSVC.
- Clang
- MongoDB
- MySQL
- UE4Game (requires github signin and approval)
AAA Games
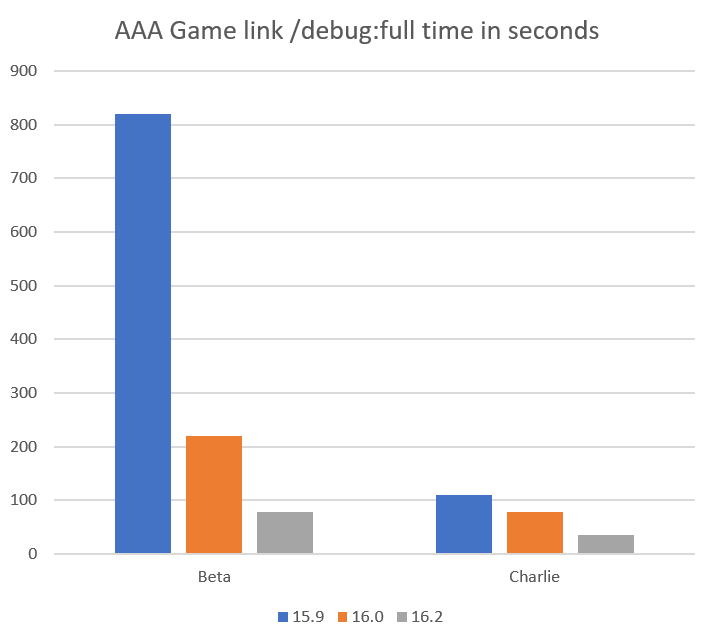
Many AAA games are great examples of large monolithic exes, and because we worked closely with some of the game studios working on AAA titles for Xbox One we can show numbers – but with the names removed. “Beta” and “Charlie” are large games that showed long link times and are representative of large production C++ source bases. These were some of our most challenging linker inputs.

As you can see from the graph the improvements can scale with the size of the input. This can change depending on project specifics but we see this general trend across all the data.
Here’s the Summary
We did a major renovation and cleanup of the component that is the dominant part of the iteration build time. These changes show wins in the 2X range for /debug:fastlink and /incremental, while /debug:full is typically 3X-6X and up. (We’ve seen 10X wins on some workloads). These wins will show up in a wide variety of workloads and are fully compatible with other binaries produced by MSVC.
Is there any more?
Link times still dominate F5 and we’re still looking for ways to speed this up. At this point we think that a lot of the low hanging fruit is plucked so we are focusing on how the toolchain as a whole manages intermediate build products and debug info. So stay tuned for more.
Take it for a test drive
We’d love for you to download Visual Studio 2019 16.2 and give it a try. As always, we welcome your feedback. We can be reached via the comments below or via email (visualcpp@microsoft.com). If you encounter problems with Visual Studio or MSVC, or have a suggestion for us, please let us know through Help > Send Feedback > Report A Problem / Provide a Suggestion in the product, or via Developer Community. You can also find us on Twitter (@VisualC) and Facebook (msftvisualcpp).
The post Improved Linker Fundamentals in Visual Studio 2019 appeared first on C++ Team Blog.