Quantcast
Channel: C++ Team Blog
Viewing all 1541 articles
Browse latest View live

C++ Productivity Improvements in Visual Studio 2019 Preview 2

$
0
0

Visual Studio 2019 Preview 2 contains a host of productivity features, including some new quick fixes and code navigation improvements:

The Quick Actions menu can be used to select the quick fixes referenced below. You can hover over a squiggle and click the lightbulb that appears or open the menu with Alt + Enter.

Quick Fix: Add missing #include

Have you ever forgotten which header to reference from the C++ Standard Library to use a particular function or symbol? Now, Visual Studio will figure that out for you and offer to fix it:
When you use a type or function defined in a different header, and that header was not #included in the file, Visual Studio squiggles the symbol in red. Now, when you hover over the squiggle, you will be shown an option to automatially add the missing #include.

But this feature doesn’t just find standard library headers. It can tell you about missing headers from your codebase too:
The add missing #include quick fix even works for non-STL headers included in your codebase, so you don't have to remember where you declared everything all the time.

Quick Fix: NULL to nullptr

An automatic quick fix for the NULL->nullptr code analysis warning (C26477: USE_NULLPTR_NOT_CONSTANT) is available via the lightbulb menu on relevant lines, enabled by default in the “C++ Core Check Type Rules,” “C++ Core Check Rules,” and “Microsoft All Rules” rulesets.
It is generally bad practice to use the "NULL" macro in modern C++ code, so Visual Studio will place a squiggle under NULLs. When you hover over such a squiggle, Visual Studio will over to replace it with a nullptr for you.
You’ll be able to see a preview of the change for the fix and can choose to confirm it if it looks good. The code will be fixed automatically and green squiggle removed.

Quick Fix: Add missing semicolon

A common pitfall for students learning C++ is remembering to add the semicolon at the end of a statement. Visual Studio will now identify this issue and offer to fix it.
Visual Studio offers to add missing semicolons to your code where needed. Just hover over the squiggle that appears and choose the option to fix it in the menu.

Quick Fix: Resolve missing namespace or scope

Visual Studio will offer to add a “using namespace” statement to your code if one is missing, or alternatively, offer to qualify the symbol’s scope directly with the scope operator:
When you forget to qualify a type or function with the namespace it comes from, Visual Studio will offer to fill in the missing namespace, along with the scope operator, in the code. Alternatively, you can let Visual Studio insert a "using namespace" statement above the code.
Note: we are currently tracking a bug with the quick fix to add “using namespace” that may cause it to not work correctly – we expect to resolve it in a future update.

Quick Fix: Replace bad indirection operands (* to & and & to *)

Did you ever forget to dereference a pointer and manage to reference it directly instead? Or perhaps you meant to refer to the pointer and not what it points to? This quick action offers to fix such issues:
Visual Studio will offer to correct errors arising from using a * insteaof a & in your code (and vice versa). Hover over the squiggle and choose the corresponding fix to resolve the issue.

Quick Info on closing brace

You can now see a Quick Info tooltip when you hover over a closing brace, giving you some information about the starting line of the code block.
When you hover over a closing brace in Visual Studio, context will be provided about the starting line of the code block.

Peek Header / Code File

Visual Studio already had a feature to toggle between a header and a source C++ file, commonly invoked via Ctrl + K, Ctrl + O, or the right-click context menu in the editor. Now, you can also peek at the other file without leaving your current one with Peek Header / Code File (Ctrl + K, Ctrl + J):
You can peek at the header of a C++ source file with Ctrl + K, Ctrl + J. You can also peek at the source file of a header the same way.

Go to Document on #include

F12 is often used to go to the definition of a code symbol. Now you can also do it on #include directives to open the corresponding file. In the right-click context menu, this is referred to as Go to Document:
You can now press F12 on a #include directive to go to that file in Visual Studio.

Other productivity features to check out

We have several more C++ productivity improvements in Preview 2, covered in separate blog posts:

We want your feedback

We’d love for you to download Visual Studio 2019 and give it a try. As always, we welcome your feedback. We can be reached via the comments below or via email (visualcpp@microsoft.com). If you encounter problems with Visual Studio or MSVC, or have a suggestion for us, please let us know through Help > Send Feedback > Report A Problem / Provide a Suggestion in the product, or via Developer Community. You can also find us on Twitter (@VisualC) and Facebook (msftvisualcpp).


In-editor code analysis in Visual Studio 2019 Preview 2

$
0
0

The C++ team has been working to refresh the Code Analysis experience inside Visual Studio. Last year, we blogged about some in-progress features in this area. We’re happy to announce that in Visual Studio 2019 Preview 2, we’ve integrated code analysis directly into the editor, improved upon previously experimental features, and enabled this as the default experience.

In-editor warnings & background analysis

Code analysis now runs automatically in the background, and warnings display as green squiggles in-editor. Analysis re-runs every time you open a file in the editor and when you save your changes.

If you wish to disable – or re-enable – this feature, you can do so via the Tools > Options > Text Editor > C++ > Experimental > Code Analysis menu, where you’ll also be able to toggle squiggles displaying in-editor or the entire new C++ Code Analysis/Error List experience.

Squiggle display improvements

We’ve also made a few improvements to the display style of in-editor warnings. Squiggles are now only displayed underneath the code segment that is relevant to the warning. If we cannot find the appropriate code segment, we fall back to the Visual Studio 2017 behavior of showing the squiggle for the entire line.

Visual Studio 2017

Visual Studio 2019

We’ve also made performance improvements, especially for source files with many C++ code analysis warnings. Latency from when the file is analyzed until green squiggles appear has been greatly improved, and we’ve also enhanced the overall UI performance during code analysis squiggle display.

Light bulb suggestions & quick fixes

We’ve begun adding light bulb suggestions to provide automatic fixes for warnings. Please see the C++ Productivity Improvements in Visual Studio 2019 Preview 2 blog post for more information.

Send us feedback

Thank you to everyone who helps make Visual Studio a better experience for all. Your feedback is critical in ensuring we can deliver the best Code Analysis experience. We’d love for you to download Visual Studio 2019 Preview 2, give it a try, and let us know how it’s working for you in the comments below or via email (visualcpp@microsoft.com). If you encounter problems or have a suggestion, please let us know through Help > Send Feedback > Report A Problem / Provide a Suggestion or via Visual Studio Developer Community. You can also find us on Twitter @VisualC.

Introducing the New CMake Project Settings UI

$
0
0

Visual Studio 2019 Preview 2 introduces a new CMake Project Settings Editor to help you more easily configure your CMake projects in Visual Studio. The editor provides an alternative to modifying the CMakeSettings.json file directly and allows you to create and manage your CMake configurations.  

If you’re just getting started with CMake in Visual Studio, head over to our CMake Support in Visual Studio introductory page

The new CMake Project Settings Editor

The goal of this editor is to simplify the experience of configuring a CMake project by grouping and promoting commonly used settings, hiding advanced settings, and making it easier to edit CMake variables. This is the first preview of this new UI so we will continue to improve it based on your feedback.  

Open the editor

The CMake Project Settings Editor opens by default when you select “Manage Configurations…” from the configuration drop-down menu at the top of the screen.  

Open the CMake Project Settings Editor by selecting "Manage Connections..." from the configuration drop-down menu at the top of the screen.

You can also right-click on CMakeSettings.json in the Solution Explorer and select “Edit CMake Settings” from the context menu. If you prefer to manage your configurations directly from the CMakeSettings.json file, you can click the link to “Edit JSON” in the top right-hand corner of the editor.  

Configurations sidebar

The left side of the editor contains a configurations sidebar where you can easily toggle between your existing configurations, add a new configuration, and remove configurations. You can also now clone an existing configuration so that the new configuration inherits all properties set by the original. 

The configurations sidebar is on the left side of the editor.

Sections of the editor

The editor contains four sections: General, Command Arguments, CMake Variables and Cache, and Advanced. The General, Command Arguments, and Advanced sections provide a user interface for properties exposed in the CMakeSettings.json file. The Advanced section is hidden by default and can be expanded by clicking the link to “Show advanced settings” at the bottom of the editor.  

The CMake Variables and Cache section provides a new way for you to edit CMake variables. You can click “Save and Generate CMake Cache to Load Variables” to generate the CMake cache and populate a table with all the CMake cache variables available for you to edit. Advanced variables (per the CMake GUI) are hidden by default. You can check “Show Advanced Variables” to show all cache variables or use the search functionality to filter CMake variables by name. 

The CMake Variables and Cache section provides a new way for you to edit CMake variables.

You can change the value of any CMake variable by editing the “Value” column of the table. Modified variables are automatically saved to CMakeSettings.json 

Linux configurations

The CMake Project Settings Editor also provides support for Linux configurations. If you are targeting a remote Linux machine, the editor will expose properties specific to a remote build and link to the Connection Manager, where you can add and remove connections to remote machines.  

CMake Settings support for Linux configurations.

Give us your feedback!

We’d love for you to download Visual Studio 2019 and give it a try. As always, we welcome your feedback. We can be reached via the comments below or via email (visualcpp@microsoft.com). If you encounter other problems with Visual Studio or MSVC or have a suggestion please let us know through Help > Send Feedback > Report A Problem / Provide a Suggestion in the product, or via Developer Community. You can also find us on Twitter (@VisualC) and Facebook (msftvisualcpp). 

Concurrency Code Analysis in Visual Studio 2019

$
0
0

Concurrency Code Analysis in Visual Studio 2019

The battle against concurrency bugs poses a serious challenge to C++ developers. The problem is exacerbated by the advent of multi-core and many-core architectures. To cope with the increasing complexity of multithreaded software, it is essential to employ better tools and processes to help developers adhere to proper locking discipline. In this blog post, we’ll walk through a completely rejuvenated Concurrency Code Analysis toolset we are shipping with Visual Studio 2019 Preview 2.

A perilous landscape

The most popular concurrent programming paradigm in use today is based on threads and locks. Many developers in the industry have invested heavily in multithreaded software. Unfortunately, developing and maintaining multithreaded software is difficult due to a lack of mature multi-threaded software development kits.

Developers routinely face a dilemma in how to use synchronization. Too much may result in deadlocks and sluggish performance. Too little may lead to race conditions and data inconsistency. Worse yet, the Win32 threading model introduces additional pitfalls. Unlike in managed code, lock acquire and lock release operations are not required to be syntactically scoped in C/C++. Applications therefore are vulnerable to mismatched locking errors. Some Win32 APIs have subtle synchronization side effects. For example, the popular “SendMessage” call may induce hangs among UI threads if not used carefully. Because concurrency errors are intermittent, they are among the hardest to catch during testing. When encountered, they are difficult to reproduce and diagnose. Therefore, it is highly beneficial to apply effective multi-threading programming guidelines and tools as early as possible in the engineering process.

Importance of locking disciplines

Because one generally cannot control all corner cases induced by thread interleaving, it is essential to adhere to certain locking disciplines when writing multithreaded programs. For example, following a lock order while acquiring multiple locks or using std::lock() consistently helps to avoid deadlocks; acquiring the proper guarding lock before accessing a shared resource helps to prevent race conditions. However, these seemingly simple locking rules are surprisingly hard to follow in practice.

A fundamental limitation in today’s programming languages is that they do not directly support specifications for concurrency requirements. Programmers can only rely on informal documentation to express their intention regarding lock usage. Thus, developers have a clear need for pragmatic tools that help them confidently apply locking rules.

Concurrency Toolset

To address the deficiency of C/C++ in concurrency support, we had shipped an initial version of concurrency analyzer back in Visual Studio 2012, with promising initial results. This tool had a basic understanding of the most common Win32 locking APIs and concurrency related annotations.

In Visual Studio 2019 Preview 2, we are excited to announce a completely rejuvenated set of concurrency checks to meet the needs of modern C++ programmers. The toolset comprises a local intra-procedural lock analyzer with built-in understanding of common Win32 locking primitives and APIs, RAII locking patterns, and STL locks.

Getting started

The concurrency checks are integrated as part of the code analysis toolset in Visual Studio. The default “Microsoft Native Recommended Ruleset” for the project comprises the following rules from the concurrency analyzer. This means, whenever you run code analysis in your project, these checks are automatically executed. These checks are also automatically executed as part of the background code analysis runs for your project. For each rule, you can click on the link to learn more about the rule and its enforcement with clear examples.

  • C26100: Race condition. Variable should be protected by a lock.
  • C26101: Failing to use interlocked operation properly for a variable.
  • C26110: Caller failing to acquire a lock before calling a function which expects the lock to be acquired prior to being called.
  • C26111: Caller failing to release a lock before calling a function which expects the lock to be released prior to being called.
  • C26112: Caller cannot hold any lock before calling a function which expects no locks be held prior to being called.
  • C26115: Failing to release a lock in a function. This introduces an orphaned lock.
  • C26116: Failing to acquire a lock in a function, which is expected to acquire the lock.
  • C26117: Releasing an unheld lock in a function.
  • C26140: Undefined lock kind specified on the lock.

If you want to try out the full set of rules from this checker, there’s a ruleset just for that. You must right click on Project > Properties > Code Analysis > General > Rulesets > Select “Concurrency Check Rules”.

Screenshot of the Code Analysis properties page that shows the ConcurrencyCheck Rules ruleset selected.

You can learn more about each rule enforced by the checker by searching for rule numbers in the ranges C26100 – C26199 in our Code Analysis for C/C++ warning document.

Concurrency toolset in action

The initial version of concurrency toolset was capable of finding concurrency related issues like race conditions, locking side effects, and potential deadlocks in mostly C-like code.

The tool had in-built understanding of standard Win32 locking APIs. For custom functions with locking side effects, the tool understood a number of concurrency related annotations. These annotations allowed the programmer to express locking behavior. Here are some examples of concurrency related annotations.

  • _Acquires_lock_(lock): Function acquires the lock object “lock”.
  • _Releases_lock_(lock): Function releases the lock object “lock”.
  • _Requires_lock_held_(lock): Lock object “lock” must be acquired before entering this function.
  • _Guarded_by_(lock) data: “data” must always be protected by lock object “lock”.
  • _Post_same_lock(lock1, lock2): “lock1” and “lock2” are aliases.

For a complete set of concurrency related annotations, please see this article Annotating Locking Behavior.

The rejuvenated version of the toolset builds on the strengths of the initial version by extending its analysis capabilities to modern C++ code. For example, it now understands STL locks and RAII patterns without having to add any annotations.

Now that we have talked about how the checker works and how you can enable them in your project, let’s look at some real-world examples.

Example 1

Can you spot an issue with this code1 ?

struct RequestProcessor {​
    CRITICAL_SECTION cs_;​
    std::map<int, Request*> cache_;​
​
    bool HandleRequest(int Id, Request* request) {​
        EnterCriticalSection(&cs_);​
        if (cache_.find(Id) != cache_.end()) ​
            return false;    ​
        cache_[Id] = request;                    ​
        LeaveCriticalSection(&cs_);   ​
    }​
    void DumpRequestStatistics() {​
        for (auto& r : cache_) ​
            std::cout << "name: " << r.second->name << std::endl;​
    }​
};​

1 If you have seen this talk given by Anna Gringauze in CppCon 2018, this code may seem familiar to you.

Let’s summarize what’s going on here:

  1. In function HandleRequest, we acquire lock cs on line 6. However, we return early from line 8 without ever releasing the lock.
  2. In function HandleRequest, we see that cache_ access must be protected by lock cs. However, in a different function, DumpStatistics, we access cache_ without acquiring any lock.

If you run code analysis on this example, you’ll get a warning in method HandleRequest, where it will complain about the leaked critical section (issue #1):

This shows the leaked critical section warning from the concurrency analyzer.

Next, if you add the _Guarded_by_ annotation on the field cache_ and select ruleset “Concurrency Check Rules”, you’ll get an additional warning in method DumpRequestStatistics for the possible race condition (issue #2):

This shows the potential race condition warning from the concurrency analyzer.

Example 2

Let’s look at a more modern example. Can you spot an issue with this code1 ?

struct RequestProcessor2 {​
    std::mutex​ m_;
    std::map<int, Request*> cache_;​
​
    void HandleRequest(int Id, Request* request) {​
        std::lock_guard grab(m_);
        if (cache_.find(Id) != cache_.end()) ​
            return;    ​
        cache_[Id] = request;                    ​
    }​
    void DumpRequestStatistics() {​
        for (auto& r : cache_) ​
            std::cout << "name: " << r.second->name << std::endl;​
    }​
};

As expected, we don’t get any warning in HandleRequest in the above implementation using std::lock_guard. However, we still get a warning in DumpRequestStatistics function:

This shows the potential race condition warning from the concurrency analyzer.

There are a couple of interesting things going on behind the scenes here. First, the checker understands the locking nature of std::mutex. Second, it understands that std::lock_guard holds the mutex and releases it during destruction when its scope ends.

This example demonstrates some of the capabilities of the rejuvenated concurrency checker and its understanding of STL locks and RAII patterns.

Give us feedback

We’d love to hear from you about your experience of using the new concurrency checks. Remember to switch to “Concurrency Check Rules” for your project to explore the full capabilities of the toolset. If there are specific concurrency patterns you’d like us to detect at compile time, please let us know.

If you have suggestions or problems with this check — or any Visual Studio feature — either Report a Problem or post on Developer Community. We’re also on Twitter at @VisualC.

New Code Analysis Checks in Visual Studio 2019: use-after-move and coroutine

$
0
0

New Code Analysis Checks in Visual Studio 2019: use-after-move and coroutine

Visual Studio 2019 Preview 2 is an exciting release for the C++ code analysis team. In this release, we shipped a new set of experimental rules that help you catch bugs in your codebase, namely: use-after-move and coroutine checks. This article provides an overview of the new rules and how you can enable them in your project.

Use-after-move check

C++11 introduced move semantics to help write performant code by replacing some expensive copy operations with cheaper move operations. With the new capabilities of the language, however, we have new ways to make mistakes. It’s important to have the tools to help find and fix these errors.

To understand what these errors are, let’s look at the following code example:

MyType m;
consume(std::move(m));
m.method();

Calling consume will move the internal representation of m. According to the standard, the move constructor must leave m in a valid state so it can be safely destroyed. However, we can’t rely on what that state is. We shouldn’t call any methods on m that have preconditions, but we can safely reassign m, since the assignment operator does not have a precondition on the left-hand side. Therefore, the code above is likely to contain latent bugs. The use after move check is intended to find exactly such code, when we are using a moved-from object in a possibly unintended way.

There are several interesting things happening in the above example:

  • std::move does not actually move m. It’s only cast to a rvalue reference. The actual move happens inside the function consume.
  • The analysis is not inter-procedural, so we will flag the code above even if consume is not actually moving m. This is intentional, since we shouldn’t be using rvalue references when moving is not involved – it’s plain confusing. We recommend rewriting such code in a cleaner way.
  • The check is path sensitive, so it will follow the flow of execution and avoid warning on code like the one below.
    Y y;
    if (condition)
      consume(std::move(y));
    if (!condition)
      y.method();

In our analysis, we basically track what’s happening with the objects.

  • If we reassign a moved-from object it is no longer moved from.
  • Calling a clear function on a container will also cleanse the “moved-from”ness from the container.
  • We even understand what “swap” does, and the code example below works as intended:
    Y y1, y2;
    consume(std::move(y1));
    std::swap(y1, y2);
    y1.method();   // No warning, this is a valid object due to the swap above.
    y2.method();   // Warning, y2 is moved-from.

Coroutine related checks

Coroutines are not standardized yet but they are well on track to become standard. They are the generalizations of procedures and provide us with a useful tool to deal with some concurrency related problems.

In C++, we need to think about the lifetimes of our objects. While this can be a challenging problem on its own, in concurrent programs, it becomes even harder.

The code example below is error prone. Can you spot the problem?

std::future async_coro(int &counter)
{
  Data d = co_await get_data();
  ++counter;
}

This code is safe on its own, but it’s extremely easy to misuse. Let’s look at a potential caller of this function:

int c;
async_coro(c);

The source of the problem is that async_coro is suspended when get_data is called. While it is suspended, the flow of control will return to the caller and the lifetime of the variable c will end. By the time async_coro is resumed the argument reference will point to dangling memory.

To solve this problem, we should either take the argument by value or allocate the integer on the heap and use a shared pointer so its lifetime will not end too early.

A slightly modified version of the code is safe, and we will not warn:

std::future async_coro(int &counter)
{
  ++counter;
  Data d = co_await get_data();
}

Here, we’ll only use the counter before suspending the coroutine. Therefore, there are no lifetime issues in this code. While we don’t warn for the above snippet, we recommend against writing clever code utilizing this behavior since it’s more prone to errors as the code evolves. One might introduce a new use of the argument after the coroutine was suspended.

Let’s look at a more involved example:

int x = 5;
auto bad = [x]() -> std::future {
  co_await coroutine();
  printf("%d\n", x);
};
bad();

In the code above, we capture a variable by value. However, the closure object which contains the captured variable is allocated on the stack. When we call the lambda bad, it will eventually be suspended. At that time, the control flow will return to the caller and the lifetime of captured x will end. By the time the body of the lambda is resumed, the closure object is already gone. Usually, it’s error prone to use captures and coroutines together. We will warn for such usages.

Since coroutines are not part of the standard yet, the semantics of these examples might change in the future. However, the currently implemented version in both Clang and MSVC follows the model described above.

Finally, consider the following code:

generator mutex_acquiring_generator(std::mutex& m) {
  std::lock_guard grab(m);
  co_yield 1;
}

In this snippet, we yield a value while holding a lock. Yielding a value will suspend the coroutine. We can’t be sure how long the coroutine will remain suspended. There’s a chance we will hold the lock for a very long time. To have good performance and avoid deadlocks, we want to keep our critical sections short. We will warn for the code above to help with potential concurrency related problems.

Enabling the new checks in the IDE

Now that we have talked about the new checks, it’s time to see them in action. The section below describes the step-by-step instructions for how to enable the new checks in your project for Preview 2 builds.

To enable these checks, we go through two basic steps. First, we select the appropriate ruleset and second, we run code analysis on our file/project.

Use after free

  1. Select: Project > Properties > Code Analysis > General > C++ Core Check Experimental Rules.
    Screenshot of the Code Analysis properties page that shows the C++ Core Check Experimental Rules ruleset selected.
  2. Run code analysis on the source code by right clicking on File > Analyze > Run code analysis on file.
  3. Observe warning C26800 in the code snippet below:
    Screenshot showing "use of a moved from object" warning

Coroutine related checks

  1. Select: Project > Properties > Code Analysis > General > Concurrency Rules.Screenshot of the Code Analysis properties page that shows the Concurrency Rules ruleset selected.
  2. Run code analysis on the source code by right clicking on File > Analyze > Run code analysis on file.
  3. Observe warning C26810 in the code snippet below:Screenshot showing a warning that the lifetime of a captured variable might end before a coroutine is resumed.
  4. Observe warning C26811 in the code snippet below:Screenshot showing a warning that the lifetime of a variable might end before the coroutine is resumed.
  5. Observe warning C26138 in the code snippet below:Screenshot shows a warning that we are suspending a coroutine while holding a lock.

Wrap Up

We’d love to hear from you about your experience of using these new checks in your codebase, and also for you to tell us what sorts of checks you’d like to see from us in the future releases of VS. If you have suggestions or problems with these checks — or any Visual Studio feature — either Report a Problem or post on Developer Community and let us know. We’re also on Twitter at @VisualC.

Visual Studio Code C/C++ extension: January 2019 Update

$
0
0

The January 2019 update of the Visual Studio Code C++ extension is now available. This release includes many new features and bug fixes including documentation comments support, improved #include autocomplete performance, better member function completion, and many IntelliSense bug fixes. For a full list of this release’s improvements, check out our release notes on Github.

Documentation Comments

We added support for documentation comments for hover, completion, and signature help. You can now see documentation comments in tooltips. Let’s look at a simple box_sample.cpp program that defines a “Box” object with various dimensions.

Class box with lenght, width, height. Function volume that takes in lenght, width, height and returns length * width * height. Main that creates a new Box package and sets length to 2.0, width to 2.0, and height to 4.0. Prints package.volume.

The comment associated with a class or member function is shown in a tooltip when you hover over a place where the class or member function is used. For example, we can see the “Box object” comment in our main function where we create a Box instance:

Hovering over Box provides a tooltip with the comment for the Box member function

#include Autocomplete

This update improves #include autocomplete performance. It now shows individual folders instead of entire paths, thus fixing previous performance issues. When you autocomplete the #include recommendation. In the example below, we modified our original box_sample.cpp program where we place the Box object definition in a separate header file within the “Objects” folder. Now, when we go into our main box_sample.cpp file and see our #include auto-complete suggestion, we see the “Objects” folder auto-complete recommendation.

#include provides an autocomplete suggestion for the Objects folder which contains the box.h header file

Improved Member Function Completion

With improved member function completion, the selected completion is committed after a parenthesis “(“ is entered. This removes the need to accept an autocompletion (using tab, enter, or click) and type the parenthesis. You will now receive the suggested text along with parentheses and the cursor in the middle for a simpler editing experience. Here’s a look at how this works with the “volume” member function for our Box object:

The volume member function in main is completed when you type just "vo" and a "("

This also works for class and member function templates after you type a “<” completion character.

Note that if you accept the autocompletion using tab, enter, or click, we do not currently auto-add the parenthesis.

IntelliSense Bug Fixes

As per customer feedback, we’re continuing to work on bug fixes for IntelliSense. This release we’ve made some IntelliSense fixes including error squiggle improvements, process crash fixes, and increased stability.

You can see additional details of the issues we fixed in our release notes on GitHub.

Tell Us What You Think

Download the C/C++ extension for Visual Studio Code, give it a try, and let us know what you think. If you run into any issues, or have any suggestions, please report them on the Issues section of our GitHub repository. Join our Insiders program to get early builds of our extension.

Please also take our quick survey to help us shape this extension to meet your needs. We can be reached via the comments below or via email (visualcpp@microsoft.com). You can also find us on Twitter (@VisualC).

C++ Binary Compatibility and Pain-Free Upgrades to Visual Studio 2019

$
0
0

Visual Studio 2019 pushes the boundaries of individual and team productivity. We hope that you will find these new capabilities compelling and start your upgrade to Visual Studio 2019 soon.

As you are considering this upgrade, rest assured that Visual Studio 2019 makes it distinctively easy to move your codebase from previous versions of Visual Studio. This post captures the reasons why your upgrade to Visual Studio 2019 will be pain-free.

Side-by-side Visual Studio Installations

You can install the latest version of Visual Studio on a computer that already has an earlier version installed and continue to use both versions in parallel with no interference. This is a great way to try Visual Studio 2019 or adopt it for some of your projects. The Visual Studio Installer will let you manage installations of Visual Studio 2017 and 2019 from a central UI.

Visual Studio Installer image showing VS 2017 and VS 2019 installed side-by-side

MSVC v140 (VS 2015.3) and MSVC v141 (VS 2017) Toolsets in the Visual Studio 2019 IDE

Even if you are not ready yet to move your project to the latest toolset (MSVC v142), you can still load your project in the Visual Studio 2019 IDE and continue to use your current older toolset.

Loading your existing C++ projects into the IDE will not upgrade/change your project files. This way, your projects also load in the previous version of the IDE in case you need to go back or you have teammates that have not yet upgraded to VS 2019 (this functionality is also known as project round-tripping).

Toolsets from older VS installations on your box are visible as platform toolsets in the latest IDE. And if you are starting fresh with only VS 2019 installed on your machine, it is very easy to acquire these older toolsets directly from the Visual Studio Installer by customizing the C++ Desktop workload (with the Individual Components tab listing all the options).

VS Installer Individual Components tab showing the full list of C++ components available in VS 2019

New v142 toolset now available

Within the Visual Studio 2019 wave (previews, its general availability, and future updates), we plan to continue evolving our C++ compilers and libraries with

  • new C++20 features,
  • faster build throughput, and
  • even better codegen optimizations.

The MSVC v142 toolset is now available and it already brings several incentives for you to migrate.

VC Runtime in the latest MSVC v142 toolset is binary compatible with v140 and v141

We heard it loud and clear that a major reason contributing to MSVC v141’s fast adoption today is its binary compatibility with MSVC v140. This allowed you to migrate your own code to the v141 toolset at your own pace, without having to wait for any of your 3rd party library dependencies to migrate first.

We want to keep the momentum going and make sure that you have a similarly successful adoption experience with MSVC v142 too. This is why we’re announcing today that our team is committed to provide binary compatibility for MSVC v142 with both MSVC v141 and v140.

This means that if you compile all your code with the v142 toolset but still have one or more libraries that are built with the v140 or v141 toolset, linking all of it together (with the latest linker) will work as expected. To make this possible, VC Runtime does not change its major version in VS 2019 and remains backward compatible with previous VC Runtime versions.

C:\source\repos\TimerApp\Debug>dumpbin TimerApp2019.exe /IMPORTS | findstr .dll
mfc140ud.dll
KERNEL32.dll
USER32.dll
GDI32.dll
COMCTL32.dll
OLEAUT32.dll
gdiplus.dll
VCRUNTIME140D.dll
ucrtbased.dll
       2EE _seh_filter_dll

When you mix binaries built with different supported versions of the MSVC toolset, there is a version requirement for the VCRedist that you redistribute with your app. Specifically, the VCRedist can’t be older than any of the toolset versions used to build your app.

Hundreds of C++ libraries on Vcpkg are available regardless of the toolset you’re using

If you are using Vcpkg today with VS 2015 or VS 2017 for one or more of your open-source dependencies, you will be happy to learn that these libraries (close to 900 at the time of this writing) can now be compiled with the MSVC v142 toolset and are available for consumption in Visual Studio 2019 projects.

If you are just getting started with Vcpkg, no worries – Vcpkg is an open-source project from Microsoft to help simplify the acquisition and building of open-source C++ libraries on Windows, Linux, and Mac.

Because v142 is binary compatible with v141 and v140, all the packages you’ve already installed will also continue to work in VS 2019 without recompilation; however, we do recommend recompiling when you can so that you can enjoy the new compiler optimizations we’ve added to v142!

If you have VS 2019 Preview installed side-by-side with an older version of VS (e.g. VS 2017), Vcpkg will prefer the stable release, so you will need to set Vcpkg’s triplet variable VCPKG_PLATFORM_TOOLSET to v142 to use the latest MSVC toolset.

MSVC compiler version changes to 19.2x (from 19.1x in MSVC v141)

Last but not least, the compiler part of the MSVC v142 toolset changes its version to 19.20 – only a minor version increment compared with MSVC v141.

VS editor with Quick Info showing that _MSC_VER macro equals 1920
Note that feature-test macros are supported in the MSVC compiler and STL starting with MSVC v141 and they should be the preferred option to enable your code to support multiple MSVC versions.

Call to action

Please download Visual Studio 2019 today and let us know what you think. Our goal is to make your transition to VS 2019 as easy as possible so, as always, we are very interested in your feedback. We can be reached via the comments below or via email (visualcpp@microsoft.com).
If you encounter other problems with Visual Studio or MSVC or have a suggestion please let us know through Help > Send Feedback > Report A Problem / Provide a Suggestion in the product, or via Developer Community. You can also find us on Twitter at @VisualC.

What’s New in CMake – Visual Studio 2019 Preview 2

$
0
0

We have made a bunch of improvements to Visual Studio’s CMake support in the latest preview of the IDE. Many of these changes are taking the first steps to close the gap between working with solutions generated by CMake and the IDE’s native support. Please try out the preview and let us know what you think.

If you are new to CMake in Visual Studio, check out how to get started.

CMake Menu Reorganization

One of the first things you might notice when you open your CMake projects in Visual Studio 2019 Preview 2 is that the CMake menu has disappeared. Don’t worry, nothing is wrong. We just reorganized these items into the existing Project, Build, Debug, and Test menus. For instance, the Project menu now looks like this:

New Project menu with CMake Settings and cache control.

The CMake settings and cache control entries have been moved from the CMake menu to the project menu. Items related to Build, Debug, and Test have been moved accordingly. We hope this reorganization is more intuitive to new users and users who have been using Visual Studio for a long time.

CMake Settings Editor

We received a lot of feedback about the CMakeSettings.json since we first shipped CMake support in Visual Studio. To simplify configuring CMake projects, we have added a graphical editor for CMake Settings.

CMake Settings editor.

You can learn more about the editor here. We would love to hear your feedback about what works well and what doesn’t for your projects. Please try it out and let us know.

Vcpkg Integration

If you have installed vcpkg, CMake projects opened in Visual Studio will automatically integrate the vcpkg toolchain file. This means you don’t have to do any additional configuration to use vcpkg with your CMake projects. This support works for both local vcpkg installations and vcpkg installations on remote machines that you are targeting. This behavior is disabled automatically when you specify any other toolchain in your CMake Settings configuration.

If you are interested in learning more about vcpkg and CMake, stay tuned. A more detailed post about using vcpkg with CMake is coming to the blog soon.

Easier CMake Toolchain Customization

If you use custom CMake toolchain files, configuring your projects just got a little bit easier. Previously, you had to manually specify CMake toolchain files with the “cmakeArgs” parameter in CMakeSettings.json. Now, instead of adding “-DCMAKE_TOOLCHAIN_FILE=…” to the command line you can simply add a “cmakeToolchain” parameter to your configuration in CMake Settings.

The IDE will warn you if you attempt to specify more than one toolchain file.

Automatic Installation of CMake on Linux Targets

Visual Studio’s Linux support for CMake projects requires a recent version of CMake to be installed on the target machine. Often, the version offered by a distribution’s default package manager is not recent enough to support all the IDE’s features. Previously, the only way to work around this was to build CMake from source or install more recent pre-built binaries manually. This was especially painful for users who targeted many Linux machines.

The latest preview of Visual Studio can automatically install a user local copy of CMake on remote Linux machines that don’t have a recent (or any) version of CMake installed. If a compatible version of CMake isn’t detected the first time you build your project, you will see an info-bar asking if you want to install CMake. With one click you will be ready to build and debug on the remote machine.

Support for Just My Code

Visual Studio 2019 Preview 2 also adds Just My Code support for CMake projects. If you are building for Windows using the MSVC compiler your CMake projects will now enable Just my Code support in the compiler and linker automatically.

To debug with Just my Code, make sure the feature is enabled in Tools > Options > Debugging > General.

Tools > Options > Debugger > General, "Enable Just My Code."

For now, you will need to use the version of CMake that ships with Visual Studio to get this functionality. This feature will be available for all installations of CMake in an upcoming version. If you need to suppress this behavior for any reason you can modify your CMakeLists to remove the “/JMC” flag from “CMAKE_CXX_FLAGS”.

Warnings for Misconfigured CMake Settings

A common source of user feedback and confusion has been the results of choosing incompatible settings for a CMake project’s configuration in CMakeSettings.json. For instance:

  • Using a 32-bit generator with a 64-bit configuration.
  • Using the wrong kind of verbosity syntax in “buildCommandArgs” for the chosen generator.

Warnings for misconfigured CMake Settings.

These misconfigurations are now called out explicitly by the IDE instead of causing CMake configuration failures that can often be difficult to diagnose.

Better Build Feedback and CMake Configure Verbosity

CMake project build and configuration progress is now better integrated into the IDE’s UI. You will see build progress in the status bar when using the Ninja and MSBuild generators.

You also now have more control over the verbosity of messages from CMake during configure. By default, most messages will be suppressed unless there is an error. You can see all messages by enabling this feature in Tools > Options > CMake.

Tools > Options > CMake > General, "Enable verbose CMake diagnostic output."

Send Us Feedback

Your feedback is a critical part of ensuring that we can deliver the best CMake experience.  We would love to know how Visual Studio 2019 Preview is working for you. If you have any feedback specific to CMake Tools, please reach out to cmake@microsoft.com. For general issues please Report a Problem.


Using VS Code for C++ development with containers

$
0
0

This post builds on using multi-stage containers for C++ development. That post showed how to use a single Dockerfile to describe a build stage and a deployment stage resulting in a container optimized for deployment. It did not show you how to use a containers with your development environment. Here we will show how to use those containers with VS Code. The source for this article is the same as that of the previous article: the findfaces GitHub repo.

Creating a container for use with VS Code

VS Code has the capability to target a remote system for debugging. Couple that with a custom build task for compiling in your container and you will have an interactive containerized C++ development environment.

We’ll need to change our container definition a bit to enable using it with VS Code. These instructions are based on some base container definitions that David Ducatel has provided in this GitHub repo. What we’re doing here is taking those techniques and applying them to our own container definition. Let’s look at another Dockerfile for use with VS Code, Dockerfile.vs.

FROM findfaces/build

LABEL description="Container for use with VS"

RUN apk update && apk add --no-cache \
    gdb openssh rsync zip

RUN echo 'PermitRootLogin yes' >> /etc/ssh/sshd_config && \
    echo 'PermitEmptyPasswords yes' >> /etc/ssh/sshd_config && \
    echo 'PasswordAuthentication yes' >> /etc/ssh/sshd_config && \
    ssh-keygen -A

EXPOSE 22 
CMD ["/usr/sbin/sshd", "-D"]

In the FROM statement we’re basing this definition on the local image we created earlier in our multi-stage build. That container already has all our basic development prerequisites, but for VS Code usage we need a few more things enumerated above. Notably, we need SSH for communication with VS Code for debugging which is configured in the RUN command. As we are enabling root login, this container definition is not appropriate for anything other than local development. The entry point for this container is SSH specified in the CMD line. Building this container is simple.

docker build -t findfaces/vs -f Dockerfile.vs .

We need to specify a bit more to run a container based on this image so VS Code can debug processes in it.

docker run -d -p 12345:22 --security-opt seccomp:unconfined -v c:/source/repos/findfaces/src:/source --name findfacesvscode findfaces/vs

One of the new parameters we haven’t covered before is –security-opt. As debugging requires running privileged operations, we’re running the container in unconfined mode. The other new parameter we’re using is -v, which creates a bind mount that maps our local file system into the container. This is so that when we edit files on our host those changes are available in the container without having to rebuild the image or copy them into the running container. If you look at Docker’s documentation, you’ll find that volumes are usually preferred over bind mounts today. However, sharing source code with a container is considered a good use of a bind mount. Note that our build container copied our src directory to /src. Therefore in this container definition we will use interactively we are mapping our local src directory to /source so it doesn’t conflict with what is already present in the build container.

Building C++ in a container with VS Code

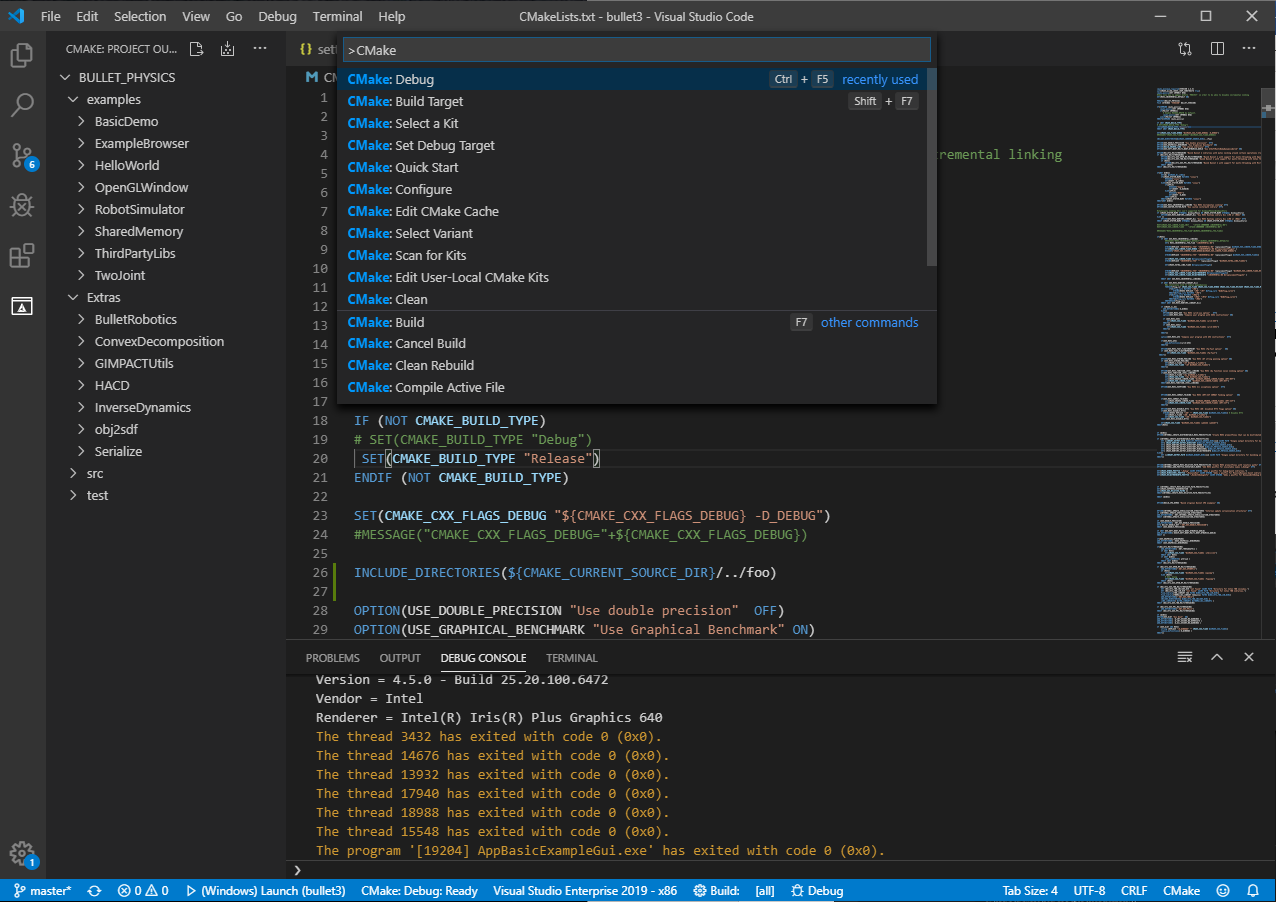
First, let’s configure our build task. This task has already been created in tasks.json under the .vscode folder in the repo we’re using with this post. To configure it in a new project, press Ctrl+Shift+B and follow the prompts until you get to “other”. Our configured build task appears as follows.

{
    "version": "2.0.0",
    "tasks": [
        {
            "label": "build",
            "type": "shell",
            "command": "ssh",
            "args": [
                "root@localhost",
                "-p",
                "34568",
                "/source/build.sh"
            ],
            "problemMatcher": [
                "$gcc"
            ]
        }
    ]
}

The “label” value tells VS Code this is our build task and the type that we’re running a command in the shell. The command here is ssh (which is available on Windows 10). The arguments are passing the parameters to ssh to login to the container with the correct port and run a script. The content of that script reads as follows.

cd /source/output && \
cmake .. -DCMAKE_BUILD_TYPE=Debug -DCMAKE_TOOLCHAIN_FILE=/tmp/vcpkg/scripts/buildsystems/vcpkg.cmake -DVCPKG_TARGET_TRIPLET=x64-linux-musl && \
make

You can see that this script just invokes CMake in our output directory, then builds our project. The trick is that we are invoking this via ssh in our container. After this is set up, you can run a build at any time from within VS Code, as long as your container is running.

Debugging C++ in a container with VS Code

To bring up the Debug view click the Debug icon in the Activity Bar. Tasks.json has already been created in the .vscode folder of the repo for this post. To create one in a new project, select the configure icon and follow the prompts to choose any configuration. The configuration we need is not one of the default options, so once you have your tasks.json select Add Configuration and choose C/C++: (gdb) Pipe Launch. The Pipe Launch configuration starts a tunnel, usually SSH, to connect to a remote machine and pipe debug commands through.

You’ll want to modify the following options in the generated Pipe Launch configuration.

            "program": "/source/output/findfaces",
            "args": [],
            "stopAtEntry": true,
            "cwd": "/source/out",

The above parameters in the configuration specify the program to launch on the remote system, any arguments, whether to stop at entry, and what the current working directory on the remote is. The next block shows how to start the pipe.

            "pipeTransport": {
                "debuggerPath": "/usr/bin/gdb",
                "pipeProgram": "C:/Windows/system32/OpenSSH/ssh.exe",
                "pipeArgs": [
                    "root@localhost",
                    "-p",
                    "34568"
                ],
                "pipeCwd": ""
            },

You’ll note here that “pipeProgram” is not just “ssh”, the full path to the executable is required. The path in the example above is the full path to ssh on Windows, it will be different on other systems. The pipe arguments are just the parameters to pass to ssh to start the remote connection. The debugger path option is the default and is correct for this example.
We need to add one new parameter at the end of the configuration.

            "sourceFileMap": {
                "/source": "c:/source/repos/findfaces/src"
            }

This option tells the debugger to map /source on the remote to our local path so that our sources our properly found.

Hit F5 to start debugging in the container. The provided launch.json is configured to break on entry so you can immediately see it is working.

IntelliSense for C++ with a container

There are a couple of ways you can setup IntelliSense for use with your C++ code intended for use in a container. Throughout this series of posts we have been using vcpkg to get our libraries. If you use vcpkg on your host system, and have acquired the same libraries using it, then your IntelliSense should work for your libraries.

System headers are another thing. If you are working on Mac or Linux perhaps they are close enough that you are not concerned with configuring this. If you are on Windows, or you want your IntelliSense to exactly match your target system, you will need to get your headers onto your local machine. While your container is running, you can use scp to accomplish this (which is available on Windows 10). Create a directory where you want to save your headers, navigate there in your shell, and run the following command.

scp -r -P 12345 root@localhost:/usr/include .

To get the remote vcpkg headers you can similarly do the following.

scp -r -P 12345 root@localhost:/tmp/vcpkg/installed/x64-linux-musl/include .

As an alternative to scp, you can also use Docker directly to get your headers. For this command the container need not be running.

docker cp -L findfacesvs:/usr/include .

Now you can configure your C++ IntelliSense to use those locations.

Keeping up with your containers

When you are done with your development simply stop the container.

docker stop findfacesvscode

The next time you need it spin it back up.

docker start findfacesvscode

And of course, you need to rerun your multi-stage build to populate your runtime container with your changes.

docker build -t findfaces/run .

Remember that in this example we have our output configured under our source directory on the host. That directory will be copied into the build container if you don’t delete it (which you don’t want), so delete the output directory contents before rebuilding your containers (or adjust your scripts to avoid this issue).

What next

We plan to continue our exploration of containers in future posts. Looking forward, we will introduce a helper container that provides a proxy for our service and to deploy our containers to Azure. We will also revisit this application using Windows containers in the future.

Give us feedback

We’d love to hear from you about what you’d like to see covered in the future about containers. We’re excited to see more people in the C++ community start producing their own content about using C++ with containers. Despite the huge potential for C++ in the cloud with containers, there is very little material out there today.

If you could spare a few minutes to take our C++ cloud and container development survey, it will help us focus on topics that are important to you on the blog and in the form of product improvements.

As always, we welcome your feedback. We can be reached via the comments below or via email (visualcpp@microsoft.com). If you encounter other problems or have a suggestion for Visual Studio please let us know through Help > Send Feedback > Report A Problem / Provide a Suggestion in the product, or via Developer Community. You can also find us on Twitter (@VisualC).


Visual Studio 2019 Preview 2 Blog Rollup

$
0
0

Visual Studio 2019 Preview 2 was a huge release for us, so we’ve written a host of articles to explore the changes in more detail. For the short version, see the Visual Studio 2019 Preview 2 Release Notes.

We’d love for you to download Visual Studio 2019 Preview, give it a try, and let us know how it’s working for you in the comments below or via email (visualcpp@microsoft.com). If you encounter problems or have a suggestion, please let us know through Help > Send Feedback > Report A Problem / Provide a Suggestion or via Visual Studio Developer Community. You can also find us on Twitter @VisualC.

AddressSanitizer (ASan) for Windows with MSVC

$
0
0

We are pleased to announce AddressSanitizer (ASan) support for the MSVC toolset. ASan is a fast memory error detector that can find runtime memory issues such as use-after-free and perform out of bounds checks. Support for sanitizers has been one of our more popular suggestions on Developer Community, and we can now say that we have an experience for ASan on Windows, in addition to our existing support for Linux projects.

At Microsoft, we believe that developers should be able to use the tools of their choice, and we are glad to collaborate with the LLVM team to introduce more of their tooling into Visual Studio. In the past, we also incorporated tools like clang-format, and most recently, clang-tidy. MSVC support for ASan is available in our second Preview release of Visual Studio 2019 version 16.4.

To bring ASan to Windows and MSVC, we made the following changes:

  • The ASan runtime has been updated to better target Windows binaries
  • The MSVC compiler can now instrument binaries with ASan
  • CMake and MSBuild integrations have been updated to support enabling ASan
  • The Visual Studio debugger now can detect ASan errors in Windows binaries
  • ASan can be installed from the Visual Studio installer for the C++ Desktop workload

When you’re debugging your ASan-instrumented binary in Visual Studio, the IDE Exception Helper will be displayed when an issue is encountered, and program execution will stop. You can also view detailed ASan logging information in the Output window.

ASan Exception in Visual Studio

Installing ASan support for Windows

ASan is included with the C++ Desktop workload by default for new installations. However, if you are upgrading from an older version of Visual Studio 2019, you will need to enable ASan support in the Installer after the upgrade:

Visual Studio Installer with ASan checkbox

You can click Modify on your existing Visual Studio installation from the Visual Studio Installer to get to the screen above.

Note: if you run Visual Studio on the new update but have not installed ASan, you will get the following error when you run your code:

LNK 1356 – cannot find library ‘clang_rt.asan_dynamic-i386.lib’


Turning on ASan for Windows MSBuild projects

You can turn on ASan for an MSBuild project by right-clicking on the project in Solution Explorer, choosing Properties, navigating under C/C++ > General, and changing the Enable Address Sanitizer (Experimental) option. The same approach can be used to enable ASan for MSBuild Linux projects.

Enabling ASan in the MSBuild project properties

Note: Right now, this will only work for x86 Release targets, though we will be expanding to more architectures in the future.


Turning on ASan for Windows CMake projects

To enable ASan for CMake projects targeting Windows, do the following:

  1. Open the Configurations dropdown at the top of the IDE and click on Manage Configurations. This will open the CMake Project Settings UI, which is saved in a CMakeSettings.json file.
  2. Click the Edit JSON link in the UI. This will switch the view to raw .json.
  3. Under the x86-Release configuration, add the following property:
    "addressSanitizerEnabled": true

You may get a green squiggle under the line above with the following warning: Property name is not allowed by the schema. This is a bug that will be fixed shortly – the property will in fact work.

Here is an image of the relevant section of the CMakeSettings.json file after the change:

Enabling ASan in the CMakeSettings.json file

We will further simplify the process for enabling ASan in CMake projects in a future update.


Contributions to ASan Runtime

To enable a great Windows experience, we decided to contribute to the LLVM compiler-rt project and reuse their runtime in our implementation of ASan. Our contributions to the ASan project include bug fixes and improved interception for

HeapAlloc
 ,
RtlAllocateHeap
 ,
GlobalAlloc
 , and
LocalAlloc
 , along with their corresponding
Free
 ,
ReAllocate
 , and
Size
 functions. Anyone can enable these features by adding the following to the
ASAN_OPTIONS
 environment variable for either Clang or MSVC on Windows:
ASAN_OPTIONS=set windows_hook_rtl_allocators=true

Additional options can be added with a colon at the end of the line above.


Changes to MSVC to enable ASan

To enable ASan, c1.dll and c2.dll have been modified to add instrumentation to programs at compile time. For a 32-bit address space, about 200 MB of memory is allocated to represent (or ‘shadow’) the entire address space. When an allocation is made, the shadow memory is modified to represent that the allocation is now valid to access. When the allocation is freed or goes out of scope, the shadow memory is modified to show that this allocation is no longer valid. Memory accesses which are potentially dangerous are checked against their entry in the shadow memory to verify that the memory is safe to access at that time. Violations are reported to the user as output from either stderr or an exception window in Visual Studio. The allocation data in the shadow memory is checked before the access happens. The AddressSanitizer algorithm enables error reports to show exactly where the problem occurred and what went wrong.

This means that programs compiled with MSVC + ASan also have the appropriate clang_rt.asan library linked for their target. Each library has a specific use case and linking can be complicated if your program is complex.


Compiling with ASan from the console

For console compilation, you will have to link the ASan libraries manually. Here are the libraries required for an x86 target:

  • clang_rt.asan-i386.lib – static runtime compatible with /MT CRT.
  • clang_rt.asan_cxx-i386.lib -static runtime component which adds support for new and delete, also compatible with /MT CRT.
  • clang_rt.asan_dynamic-i386.lib – dynamic import library, compatible with /MD CRT.
  • clang_rt.asan_dynamic-i386.dll – dynamic runtime DLL, compatible with /MD.
  • clang_rt.asan_dynamic_runtime_thunk-i386.lib – dynamic library to import and intercept some /MD CRT functions manually.
  • clang_rt.asan_dll_thunk-i386.lib – import library which allows an ASAN instrumented DLL to use the static ASan library which is linked into the main executable. Compatible with /MT CRT.

Once you have selected the correct ASan runtime to use, you should add

/wholearchive:<library to link>
 to your link line and add the appropriate library to your executables. The clang_rt.asan_dynamic_i386.dll is not installed into System32, so when running you should make sure it is available in your environment’s search path.

Some additional instructions:

  • When compiling a single static EXE: link the static runtime (asan-i386.lib) and the cxx library if it is needed.
  • When compiling an EXE with the /MT runtime which will use ASan-instrumented DLLs: the EXE needs to have asan-i386.lib linked and the DLLs need the clang_rt.asan_dll_thunk-i386.lib. This allows the DLLs to use the runtime linked into the main executable and avoid a shadow memory collision problem.
  • When compiling with the /MD dynamic runtime: all EXE and DLLs with instrumentation should be linked with copies of asan_dynamic-i386.lib and clang_rt.asan_dynamic_runtime_thunk-i386.lib. At runtime, these libraries will refer to the clang_rt.asan_dynamic-i386.dll shared ASan runtime.

The ASan runtime libraries patch memory management functions at run-time and redirect executions to an ASan wrapper function which manages the shadow memory. This can be unstable if the runtime environment differs from what the libraries have been written to expect. Please submit any compile or run time errors which you encounter while using ASan via the feedback channels below!


Send us feedback!

Your feedback is key for us to deliver the best experience running ASan in Visual Studio. We’d love for you to try out the latest Preview version of Visual Studio 2019 version 16.4 and let us know how it’s working for you, either in the comments below or via email. If you encounter problems with the experience or have suggestions for improvement, please Report A Problem or reach out via Developer Community. You can also find us on Twitter @VisualC.

The post AddressSanitizer (ASan) for Windows with MSVC appeared first on C++ Team Blog.

Microsoft C++ Team At CppCon 2019: Videos Available

$
0
0

Last month a large contingent from the Microsoft C++ team attended CppCon. We gave fourteen presentations covering our tools, developments in the standard, concepts which underlie the work we do, and more.

We also recorded an episode of CppCast with Microsoft MVPs Rob Irving and Jason Turner. You can hear more about the Open Sourcing of MSVC’s STL, the upcoming ASAN support in Visual Studio and our team’s effort in achieving C++17 standards conformance.

All our CppCon videos are available now, so please give them a watch and let us know what you think!

If you have any subjects you’d like us to consider talking about at CppCon 2020 or other conferences, please let us know. We can be reached via the comments below, email (visualcpp@microsoft.com), and Twitter (@VisualC).

The post Microsoft C++ Team At CppCon 2019: Videos Available appeared first on C++ Team Blog.

An Update on C++/CLI and .NET Core

$
0
0

The first public release of our C++/CLI support for .NET Core 3.1 is now available for public preview! It is included in Visual Studio 2019 update 16.4 Preview 2. We would love it if you could try it out and send us any feedback you have. For more info about what this is and the roadmap going forward, check out my last post on the future of C++/CLI and .NET Core.

To get started make sure you have all the necessary components installed. C++/CLI support for desktop development is an optional component, so you will need to select it on the installer’s right pane:

Install the “Desktop development with C++” workload and be sure to include the optional “C++/CLI support” component.

You will also need the .NET Core cross-platform development workload. It installs everything you need including the .NET Core 3.1 SDK:

Alt: Install the “.NET Core cross-platform development” workload.

Creating a C++/CLI .NET Core Project

First, you will want to create a “CLR Class Library (.NET Core)” or “CLR Empty Project (.NET Code)”. The Class library template includes some additional boiler plate to set up an example class and precompiled header that may make it easier to get started. The empty project is ideal for bringing in existing C++/CLI code. Retargeting existing C++/CLI projects to .NET Core isn’t recommended.

There isn’t currently a template for C++/CLI console or Windows applications that can be used with .NET Core. Instead you must put application entry point outside of the C++/CLI code. In general, we strongly recommend keeping the C++/CLI projects as narrow in scope as possible to handle just the interoperability between .NET Core and other C++ code.

Once you create one of these projects, you can reference it from other .NET Core projects like any other class library – with one important caveat. .NET Core projects are typically architecture agnostic. You see this as the architecture “Any CPU” in the Configuration Manager and “MSIL” in the build logs. This is the default for all .NET Core projects. If you reference any C++/CLI class libraries, you must specify an explicit architecture for the non-C++ projects instead of “Any CPU”.

You can set a project’s architecture by using the Configuration Manager.

If the architectures don’t match, you will see this warning and attempting to load the C++/CLI class library will fail at runtime:

“Warning MSB3270 There was a mismatch between the processor architecture of the project being built "MSIL" and the processor architecture of the reference…”

To resolve this, make sure all projects in the solution are using the same architecture of “x86” and “Win32” or “x64”. If you are using ASP.NET Core, there is an additional consideration. Your projects also need to match the architecture of IIS Express. This is typically “x64”. If you see a “500 server error” due to the loader failing, this may be what the problem is.

Send us Feedback

Please try this out. We’d love to hear your feedback to help us prioritize and build the right features. We can be reached via the comments below or email (visualcpp@microsoft.com). You also can always send us general feedback via Developer Community.

The post An Update on C++/CLI and .NET Core appeared first on C++ Team Blog.

Visual Studio Code C++ extension: Nov 2019 update

$
0
0

The November 2019 update of the Visual Studio Code C++ extension is now available. This latest release comes with a big list of improvements: Find All References, Rename Symbol refactoring, support for localization, new navigation breadcrumb controls, and improvements to the Outline view to name a few. For a more detailed list of changes, check out our release notes on GitHub.

Find All References

Now you can right-click on a C++ symbol anywhere in your file and select Find All References from the context menu. This will search for all instances of a symbol inside the current workspace. Depending on the symbol selected, the search will show at first a progress bar while it is searching for all instances of that symbol or directly display the results in the References Results view.

C++ editor with context menu showing "Find all references" menu item selected

Progress dialog showing "Find all References" operation with 30 files out of 37 completed

The References Results window will display its results into two panes – the top one will show the confirmed results: those instances where IntelliSense confirmed that the text match is also a semantic match for the symbol you searched for. The bottom pane will show all other text matches, categorized by the location where they were found e.g. in a string, in a comment or inside an inactive macro block.

Find all references results showing in the References Window

You can clear individual results from the list or all the results by using the controls in the References Results window. If you clear all the results, you can also review the list of previous searches and you have the option to rerun them.

References results windows showing history of searches

Rename Symbol refactoring

The Rename symbol operation is unquestionably the most requested refactoring tool by C++ developers. With the November 2019 release, we’re happy to announce that this functionality is now supported in the C++ extension. Whether you directly invoke Rename via its keyboard shortcut F2, or select it from the context menu, you will be prompted with a textbox that allow you to introduce the new symbol name.

C++ editor with Rename operation in progress

If all the references to the symbol can be confirmed, the rename operation is performed immediately after you confirm the new name for your symbol. Otherwise, a list of candidates is displayed in the C++ Rename Results window. Before committing the refactor operation, you now have the option to include additional candidates for rename that were found as text matches (not semantic matches) during the search e.g. in strings, comments or inactive blocks.

Pending Rename window showing confirmed changes and additional candidates for rename

To confirm a rename operation, click on the “Commit Rename” action on the “Pending rename” title bar.

Localization support

With this version, the C++ extension UI, command names, tooltips, warnings, and errors are all localized and will respect your choice of language that you selected via the “Configure Display Language” command.

Visual Studio Code with UI elements in Japanese

Navigation breadcrumbs in C++ editors and Outline view improvements

The C++ editor now includes in its navigation breadcrumbs the symbol path up to the cursor position in addition to the file path. To quickly navigate to the Breadcrumbs UI, you can run the “Focus Breadcrumbs” command (default keyboard shortcut for this command is Ctrl+Shift+. or Command+Shift+.). To switch between the different elements in the UI, use the Left and Right keyboard shortcuts (which default to Ctrl+Left Arrow/Right Arrow or Option+Left Arrow/Right Arrow).

C++ editor with breadcrumb dropdown expanded

You can also customize the appearance of breadcrumbs. If you have very long paths or are only interested in either file paths or symbol paths, you can configure breadcrumbs.filePath and breadcrumbs.symbolPath settings (both support on, off, and last). By default, breadcrumbs show icons, but you can remove that by setting breadcrumbs.icons to false.

New in this release also is the ability for Outline view (as well as the new Breadcrumb section) to list the C++ symbols as a hierarchy rather than a flat list.

Outline window showing hierarchy of C++ types

What do you think?

Download the C++ extension for Visual Studio Code today, give it a try, and let us know what you think. If you run into any issues, or have any suggestions, please report them in the Issues section of our GitHub repository. You can also join our Insiders program and get access to early builds of our releaseby going to File > Preferences > Settings (Ctrl+,) and under Extensions > C/C++, change the “C_Cpp: Update Channel” to “Insiders”.

We can be reached via the comments below or in email at visualcpp@microsoft.com. You can also find our team on Twitter at @VisualC.


The post Visual Studio Code C++ extension: Nov 2019 update appeared first on C++ Team Blog.

Introducing C++ Build Insights

$
0
0

C++ builds should always be faster. In Visual Studio 2019 16.2, we’ve shown our commitment to this ideal by speeding up the linker significantly. Today, we are thrilled to announce a new collection of tools that will give you the power to make improvements of your own. If you’ve ever had time for breakfast while building C++, then you may have asked yourself: what is the compiler doing? C++ Build Insights is our latest take at answering this daunting question and many others. By combining new tools with tried-and-tested Event Tracing for Windows (ETW), we’re making timing information for our C++ toolchain more accessible than ever before. Use it to make decisions tailored to your build scenarios and improve your build times.

Getting started

Start by obtaining a copy of Visual Studio 2019 version 16.4 Preview 3. Then follow the instructions on the Getting started with C++ Build Insights documentation page.

Capturing timing information for your build boils down to these four steps:

  • Launch an x64 Native Tools Command Prompt for VS 2019 Preview as an administrator.
  • Run: vcperf /start MySessionName
  • Build your project.
  • Run: vcperf /stop MySessionName myTrace.etl

Choose a name for your session and for your trace file. After executing the stop command, all information pertaining to your build will be stored in the myTrace.etl file.

ETW allows C++ Build Insights to collect information from all compilers and linkers running on your system. You don’t need to build your project from the same command prompt as the one you are using vcperf from. You can either use a different command prompt, or even Visual Studio.

Another advantage of ETW is that you don’t need to add any compiler or linker switches to collect information because the operating system activates logging on your behalf. For this reason, C++ Build Insights will work with any build system, no configuration necessary!

Once you’ve collected your trace, open it in Windows Performance Analyzer (WPA). This application is part of the Windows Performance Toolkit. Details on which version of WPA you need to view C++ Build Insights traces can be found in the Getting started documentation page.

In the following sections, we show you a glimpse of what you will find after opening your trace in WPA. We hope to convince you to try out these new tools and explore your build!

At the crux of the matter with the Build Explorer

Central to understanding a build is having an overview of what happened through time. The Build Explorer is a core element of C++ Build Insights that we designed for this purpose. Drag it from the Graph Explorer panel on the left onto the main analysis window in WPA. Use it to diagnose parallelism issues, detect bottlenecks, and determine if your build is dominated by parsing, code generation, or linking.


Gif showing the tool in action


A thousand scoffs for the thousand cuts: aggregated statistics

The most insidious of build time problems are the ones that strike you little by little until the damage is so large that you wonder what hit you. A common example is the repetitive parsing of the same header file due to its inclusion in many translation units. Each inclusion may not have a large impact by itself but may have devastating effects on build times when combined with others. C++ Build Insights provides aggregated statistics to assist you in warding off such threats. An example of this capability is illustrated below, where file parsing statistics are aggregated over an entire build to determine the most time-consuming headers. To view this information for your build, choose the Files view from the Graph Explorer panel on the left in WPA. Drag it to the analysis window.


Analysis window showing the number of times a header was included and the accumulative time it took.


What information can you get?

With C++ Build Insights, expect to be able to obtain the following information for all your compiler and linker invocations.

For the front-end: Overall front-end time, individual files parsing time. For the back-end: overall back-end time, function optimization time, whole program analysis time, code generation thread time, whole program analysis thread time. For the general compiler: overall compiler time, command line, inputs/outputs, working directory, tool path. For the general linker: overall linker time, pass 1 time, pass 2 time, link-time code generation time, command line, inputs/outputs, working directory, tool path.

Tell us what you think!

Download your copy of Visual Studio 2019 version 16.4 Preview 3, and get started with C++ Build Insights today!

In this article, we shared two features with you, but there is much more to come! Stay tuned for more blog posts detailing specific ways in which you can use C++ Build Insights to improve your builds.

We look forward to hearing from you on how you used vcperf and WPA to understand and optimize your builds. Are there any other pieces of information you would like to be able to get from C++ Build Insights? Tell us what you think in the comments below. You can also get in touch with us at visualcpp@microsoft.com, or on Twitter @VisualC.

The post Introducing C++ Build Insights appeared first on C++ Team Blog.


EA and Visual Studio’s Linux Support

$
0
0

EA is using Visual Studio’s cross-platform support to cross-compile on Windows and debug on Linux. The following post is written by Ben May, a Senior Software Engineer of Engineering Workflows at EA. Thanks Ben and EA for your partnership, and for helping us make Visual Studio the best IDE for C++ cross-platform development.

At EA our Frostbite Engine has a Linux component used for our dedicated servers that service many of our most popular games.  When we saw that Microsoft was adding support for Linux in a workload in Visual Studio, this caught my interest!  At EA our game developers are used to a Windows environment for development so we thought that forcing them to develop in a Linux environment directly would be a difficult ask, so we decided to use clang and cross-compile from Windows and target Linux.  Initially we had wired this up ourselves using Visual Studio Makefile Projects which called make to build our source, and then used a variety of tools to copy binaries over ssh to Linux machines, then wrote tooling to startup gdbserver on the remote Linux machine to be able to debug from PC.  After the release of the Visual Studio Linux Workload, we found that Microsoft had basically wrapped up all of the tools/processes up nicely into a Visual Studio Workload we could ask our Developers to install and be able to debug directly in Visual Studio!  So far the integration with WSL and remote debugging the workload provides has been a success and has drastically cleaned up our tools/processes surrounding Linux debugging/development.  Our developers have been really happy with the improved experience.

I will now explain in more detail what we actually do.

Internal build setup

Our internal build setup uses our own proprietary tool to take our own cross platform build format and generate many types of outputs (vcxproj/csproj/make etc.) When we decided to add Linux to our list of supported platforms, we decided that we would set up our primary workflow for our developers to be initiated from a Windows based PC with Visual Studio, since this is the environment that we use for almost all of our other platforms.  Another requirement was for our CI (Continuous Integration/Build Farm) to be able to validate that our code compiled on Linux without needing to setup Linux host based CI VMs or needing a remote Linux system to compile the code, since that would be much more expensive and complicated to manage and support.  These requirements basically led us to deciding to cross-compile our codebase on Windows directly using clang on PC.

For our cross-compiler we use something called a “Canadian cross” compiler setup.  See toolchain types for more details on the types of cross-compile you can do, and a Wikipedia link for why its called “Canadian cross”.  The primary reason for it being a “Canadian cross” is that we have built the LLVM and GCC toolchains on a Linux machine and moved their pieces to be used on a Windows machine combined with Windows clang.  Based on that our cross-compiler setup on Windows has the following in it:

  1. We use LLVM
  2. We combine the Windows version of LLVM with the Linux one on the Windows machine.  This is to get all of the libs/headers required for targeting Linux.
  3. We also use the GCC toolchain with LLVM.  In order to build the gcc tools for Windows we use crosstool-NG on a Linux host to build it.
  4. Then when building you need to pass -target x86_64-pc-linux-gnu and -sysroot=<path to gcc cross tools>
  5. You may need to initially use -Wno-nonportable-include-path warning suppression since Windows is not case-sensitive, and fixing all of the include path errors might be a bit of a lengthy task (although I recommend doing it!)

After we have assembled our toolchain, we then use our proprietary generator to generate makefiles that build our code for us but referencing the above cross-compiler setup, and then a set of vcxproj files which are of type “Linux Makefile” and .sln file.  It is at this point where we move into Visual Studio for integration of our workflows into the IDE using the Visual Studio Linux Workload.

Visual Studio integration

Developers need to ensure they have the ‘Linux development with C++Workload installed:

The Linux development with C++ workload in the Visual Studio installer.

After ensuring the correct components are installed, we use the built in features of the Linux Makefile projects for working.  To build code we simply select Build from within Visual Studio, this executes our cross-compiler and outputs binaries.  Built into the Visual Studio Linux Projects is the ability to deploy and debug on a Linux host. 

Debugging on WSL

We can configure our generator to use 2 different deployment/debugging setups:

  1. WSL (Windows Subsystem For Linux)
  2. Remote Linux Host

The most convenient setup is WSL assuming you do not have to render anything to screen.  In other words, if it’s only headless unit tests or console applications you need to develop this is the easiest and fastest way to iterate.

If the developer is using WSL, then the binaries do not actually need to be deployed since WSL can access the binaries directly from the current Windows machine, this saves time since they no longer need to be copied/deployed to a remote machine (some of our binaries can get quite large so can sometimes add several seconds to an incremental build + debug session)

Here is an example of me building EASTL, an open-source library of EAs, using Visual Studio Linux Makefile Projects and our cross-compiler:

Debugging EASTL using Visual Studio Linux Makefile Projects.

You can see I’ve placed a breakpoint there, and I configured my environment to use WSL when running, so when I debug it will launch the test binary in WSL and connect the debugger using Visual Studio’s gdb debugger without needing to first copy the binary.  This achieved by setting the Remote Build Root, Project and Deploy directories with the path being the WSL path to the same folder on my Windows machine.

The "General" configuration properties for a Linux Makefile Project, where "Remote Build Root Directory" is a mounted WSL path.

Here is a quick example of me debugging and hitting a breakpoint, then continuing to run and finish the unit test:

EA debugging a unit test on the Windows Subsystem for Linux.

Debugging on a remote Linux system

For a Remote Linux machine setup where we do not use WSL, the only additional thing we need to worry about is the deployment of the built executable and its dependent dynamic libraries or content files.  The way we do this is we setup a source file to remote mapping, and have Visual Studio’s post build event do the copying of the file.  Inside the properties of the exe’s Project under “Build Events” -> “Post-Build Event” -> “Additional Files To Copy, we specify the list of files needed to be copied to the remote machine after the build completes.  This is needed to happen so that when we click “Debug” the binaries are already there on the Remote Machine.

Setting up a remote post-build event with additional files to copy in Visual Studio's Property Pages.

You can see that the syntax is a mapping of local path to remote path, which is quite handy for mapping files between the 2 file systems.

Asks for the future

One downside to this is that the deployment is done during the “Build” phase, what we would ideally like is to have 3 distinct phases when working with Linux:

  1. Build
  2. Deploy
  3. Debug

This would be so that you could build the code without needing a connection to a remote machine, this is useful in CI environments, or in environments where someone just wants to locally build and fix compile issues for Linux and submit them and let automated testing validate their fixes.  Having Deploy and Debug distinct phases is also nice so that you could deploy from visual studio, but then potentially invoke/debug etc. directly from the Linux Machine.

It is also worth noting at this point that we are still using make “under the hood” to execute our builds for Linux, but the Visual Studio Linux Workload also supports a full MSBuild-based Linux Project.  We have not spent much time trying that out at this point, but it would be nice if we could use that, in an effort to be using MSBuild to build Linux just like we do for most of our other platforms.

We have been working closely with the Visual Studio team on the Linux Component, and have been following the Visual Studio 2019 Preview builds very closely to test and iterate on these workflows with them, our hope is that in future releases we will be able to:

  1. Fully separate Build from Deployment and Debug for local cross-compilation scenarios.
  2. Setup “incremental” build + deployment detection in the Linux Makefile Projects so that we don’t need to respawn make for all projects in our Solutions (some of our large solutions have > 500 projects).  This is mainly for a faster incremental iteration times.
  3. We have asked for direct WSL debugging be added to the Linux Makefile Projects, currently in our setup since the Linux Makefile Projects don’t support WSL directly we still need to debug over an ssh connection to wsl which means we have to have WSL running with sshd on it. This support is already integrated with MSBuild-based Linux Applications and CMake projects, but not yet for Makefile projects.
  4. Try the MSBuild-based Linux Project files and work with Microsoft to get those to potentially operate with a local toolchain (our cross-compiler) but still yield the same features for Deployment and Debug.  This would also help us solve the Makefile incremental problem mentioned above.

All in all this workflow is very slick for us!  It allows our developers to use an IDE and Operating System they are comfortable working in, but are still able to build and debug Linux applications!

-Ben May, Senior Software Engineer, Engineering Workflows at EA

Thanks again for your partnership, Ben! Our team looks forward to continuing to improve the product based on feedback we receive from the community. If you’re interested in building the same project on both Windows and Linux, check out our native support for CMake. You can check out a similar story written by the MySQL Server Team at Oracle.

The post EA and Visual Studio’s Linux Support appeared first on C++ Team Blog.

Set Environment Variables for Debug, Launch, and Tools with CMake and Open Folder

$
0
0

There are many reasons why you may want to customize environment variables. Many build systems use environment variables to drive behavior; debug targets sometimes need to have PATH customized to ensure their dependencies are found; etc. Visual Studio has a mechanism to customize environment variables for debugging and building CMake projects and C++ Open Folder. In Visual Studio 2019 16.4 we made some changes to simplify this across Visual Studio’s JSON configuration files.

This post is going to cover how to use this feature from the ground up with the new changes since not everyone may be familiar with how and when to use this feature. However, for those who have used the feature before, here’s a quick summary of the changes:

  • Your existing configuration files will still work with these changes, but IntelliSense will recommend using the new syntax going forward.
  • Debug targets are now automatically launched with the environment you specify in CMakeSettings.json and CppProperties.json. Custom tasks have always had this behavior and still do.
  • Debug targets and custom tasks can have their environments customized using a new “env” tag in launch.vs.json and tasks.vs.json.
  • Configuration-specific variables defined in CppProperties.json are automatically picked up by debug targets and tasks without the need to set “inheritEnvironments”. CMakeSettings.json has always worked this way and still does.

Please try out the new preview and let us know what you think.

Customizing Environment Variables

There are now two ways to specify environment variables for CMake and C++ Open Folder. The first is to set up the overall build environment. This is done in CMakeSettings.json for CMake and CppProperties.json for C++ Open Folder. Environment variables can be global for the project or specific to an individual configuration (selected with the configuration dropdown menu). These environment variables will be passed to everything, including CMake builds, custom tasks, and debug targets.

Environment variables can also be used in any value in Visual Studio’s configuration JSON files using the syntax:

"${env.VARIABLE_NAME}"

Global and configuration specific environment variables can be defined in “environment” blocks in both CMakeSettings.json and CppProperties.json. For example, the following example sets environment variables differently for a “Debug” and “Release” configuration in CMakeSettings.json:

{
  // These environment variables apply to all configurations.
  "environments": [
    {
      "DEBUG_LOGGING_LEVEL": "warning"
    }
  ],

  "configurations": [
    {
      // These environment variables apply only to the debug configuration.
      // Global variables can be overridden and new ones can be defined.
      "environments": [
        {
          "DEBUG_LOGGING_LEVEL": "info;trace",
          "ENABLE_TRACING": "true"
        }
      ],

      "name": "Debug",
      "generator": "Ninja",
      "configurationType": "Debug",
      "inheritEnvironments": [ "msvc_x64_x64" ],
      "buildRoot": "${projectDir}\\out\\build\\${name}",
      "installRoot": "${projectDir}\\out\\install\\${name}",
      "cmakeCommandArgs": "",
      "buildCommandArgs": "-v",
      "ctestCommandArgs": "",
      "variables": []
    },

    {
      // Configurations do not need to override environment variables.
      // If none are defined, they will inherit the global ones.

      "name": "Release",
      "generator": "Ninja",
      "configurationType": "RelWithDebInfo",
      "buildRoot": "${projectDir}\\out\\build\\${name}",
      "installRoot": "${projectDir}\\out\\install\\${name}",
      "cmakeCommandArgs": "",
      "buildCommandArgs": "-v",
      "ctestCommandArgs": "",
      "inheritEnvironments": [ "msvc_x64_x64" ],
      "variables": []
    }
  ]
}

The second way to specify environment variables is used to customize individual debug targets and custom tasks. This is done in launch.vs.json and tasks.vs.json respectively. To do this, you add an “env” tag to individual targets and tasks that specifies the environment variables that need to be customized. You can also unset a variable by setting it to null.

The following example sets an environment variable for a debug target to enable some custom logging in launch.vs.json and the same “env” syntax can be applied to any task in tasks.vs.json:

{
  "version": "0.2.1",
  "defaults": {},
  "configurations": [
    {
      "type": "default",
      "project": "cmake\\CMakeLists.txt",
      "projectTarget": "envtest.exe",
      "name": "envtest.exe",
      "env": {
        "DEBUG_LOGGING_LEVEL": "trace;info"
        "ENABLE_TRACING": "true"
      }
    }
  ]
}

Keep in mind, if you want an environment variable to be set for all debug targets and tasks, it is better to do it globally in CMakeSettings.json or CppProperties.json

Send us Feedback

Your feedback is a critical part of ensuring that we can deliver the best experience.  We would love to know how Visual Studio 2019 version 16.4 is working for you. If you find any issues or have a suggestion, the best way to reach out to us is to Report a Problem.

The post Set Environment Variables for Debug, Launch, and Tools with CMake and Open Folder appeared first on C++ Team Blog.

CMake Tools Extension for Visual Studio Code

$
0
0

Microsoft is now the primary maintainer of the CMake Tools extension for Visual Studio Code. The extension was created and previously maintained by vector-of-bool, who has moved on to other things. Thank you vector-of-bool for all of your hard work getting this extension to where it is today!

About the extension

The CMake Tools extension provides developers with a convenient and powerful workflow for configuring, building, browsing, and debugging CMake-based projects in Visual Studio Code. You can visit the CMake Tools documentation and the extension’s GitHub repository to get started and learn more.

The following screenshot of the extension shows a logical view of the open-source CMake project bullet3 organized by target (left) and several CMake-specific commands.

An image of the CMake Tools extension for VS Code, with a project outline to the left and several CMake-specific commands in the command palette.

We recommend using the CMake Tools extension alongside the C/C++ extension for Visual Studio Code for IntelliSense configuration and a full-fidelity C/C++ development experience.

Feedback is welcome

Download the CMake Tools extension for Visual Studio Code today and give it a try. If you run into issues or have suggestions for the team, please report them in the issues section of the extension’s GitHub repository. You can also reach the team via email (visualcpp@microsoft.com) and Twitter (@VisualC).

The post CMake Tools Extension for Visual Studio Code appeared first on C++ Team Blog.

Build C++ Applications in a Linux Docker Container with Visual Studio

$
0
0

Docker containers provide a consistent development environment for building, testing, and deployment. The virtualized OS, file system, environment settings, libraries, and other dependencies are all encapsulated and shipped as one image that can be shared between developers and machines. This is especially useful for C++ cross-platform developers because you can target a container that runs a different operating system than the one on your development machine.

In this blog post we’re going to use Visual Studio’s native CMake support to build a simple Linux application in a Linux docker container over SSH. This post focuses on creating your first docker container and building from Visual Studio. If you’re interested in learning more about Docker as a tool to configure reproducible build environments, check out our post on using multi-stage containers for C++ development.

This workflow leverages Visual Studio’s native support for CMake, but the same instructions can be used to build a MSBuild-based Linux project in Visual Studio.

Set-up your first Linux docker container

First, we’ll set-up a Linux docker container on Windows. You will need to download the Docker Desktop Client for Windows and create a docker account if you haven’t already. See Install Docker Desktop on Windows for download information, system requirements, and installation instructions.

We’ll get started by pulling down an image of the Ubuntu OS  and running a few commands. From the Windows command prompt run:

> docker pull ubuntu

This will download the latest image of Ubuntu from Docker. You can see a list of your docker images by running:

> docker images

Next, we’ll use a Dockerfile to create a custom image based on our local image of Ubuntu. Dockerfiles contain the commands used to assemble an image and allow you to automatically reproduce the same build environment from any machine. See Dockerfile reference for more information on authoring your own Dockerfiles. The following Dockerfile can be used to install Visual Studio’s required build tools and configure SSH. CMake is also a required dependency but I will deploy statically linked binaries directly from Visual Studio in a later step. Use your favorite text editor to create a file called ‘Dockerfile’ with the following content.

# our local base image
FROM ubuntu 

LABEL description="Container for use with Visual Studio" 

# install build dependencies 
RUN apt-get update && apt-get install -y g++ rsync zip openssh-server make 

# configure SSH for communication with Visual Studio 
RUN mkdir -p /var/run/sshd

RUN echo 'PasswordAuthentication yes' >> /etc/ssh/sshd_config && \ 
   ssh-keygen -A 

# expose port 22 
EXPOSE 22

We can then build an image based on our Dockerfile by running the following command from the directory where your Dockerfile is saved:

> docker build -t ubuntu-vs .

Next, we can run a container derived from our image:

> docker run -p 5000:22 -i -t ubuntu-vs /bin/bash

The -p flag is used to expose the container’s internal port to the host. If this step was successful, then you should automatically attach to the running container. You can stop your docker container at any time and return to the command prompt using the exit command. To reattach, run docker ps -a, docker start <container-ID>, and docker attach <container-ID> from the command prompt.

Lastly, we will interact with our docker container directly to start SSH and create a user account to use with our SSH connection. Note that you can also enable root login and start SSH from your Dockerfile if you want to avoid any manual and container-specific configuration. Replace <user-name> with the username you would like to use and run:

> service ssh start
> useradd -m -d /home/<user-name> -s /bin/bash -G sudo <user-name>
> passwd <user-name>

The -m and -d flags create a user with the specified home directory, and the -s flag sets the user’s default shell.

You are now ready to connect to your container from Visual Studio.

Connect to your docker container from Visual Studio

Make sure you have Visual Studio 2019 and the Linux development with C++ workload installed.

Open Visual Studio 2019 a create a new CMake Project. CMake is cross-platform and allows you to configure an application to run on both Windows and Linux.

Once the IDE has loaded, you can add a SSH connection to your Linux docker container the same way you would add any other remote connection. Navigate to the Connection Manager (Tools > Options > Cross Platform > Connection Manager) and select “Add” to add a new remote connection.

Add a new remote connection in Visual Studio, with input fields for host name, port, user name, authentication type, and password.

Your host name should be “localhost”, the port should be whatever you are using for your SSH connection (in this example we’re using 5000), and your username and password should match the user account that you just created for your container.

Configure build in Visual Studio

At this point the project behaves like any other CMake project in Visual Studio. To configure and build the console application in our Linux container navigate to “Manage Configurations…” in the configuration drop-down.

You can then select the green plus sign in the CMake Settings Editor to add a new “Linux-Debug” configuration. Make sure that the remote machine name of your Linux configuration matches the remote connection we created for our Linux docker container.

Remote machine name property in the CMake Settings Editor showing the local docker container I am connected to

Save the CMake Settings Editor (ctrl + s) and select your new Linux configuration from the configuration drop-down to kick off a CMake configuration. If you don’t already have CMake installed on your docker container, then Visual Studio will prompt you to deploy statically linked binaries directly to your remote connection as a part of the configure step.

At this point you can build your application in your Linux docker container directly from Visual Studio. Additional build settings (including custom toolchain files, CMake variables, and environment variables) can be configured in the CMake Settings Editor. The underlying CMakeSettings.json file can store multiple build configurations and can be checked into source control and shared between team members.

Coming next

This post showed you how to build a C++ application in a Linux docker container with Visual Studio. Stay tuned for our next post, where will we show you how to copy the build artifacts back to your local Windows machine and debug using gdbserver on a second remote system.

Give us your feedback

Do you have feedback on our Linux tooling or CMake support in Visual Studio? We’d love to hear from you to help us prioritize and build the right features for you. We can be reached via the comments below, Developer Community, email (visualcpp@microsoft.com), and Twitter (@VisualC).

The post Build C++ Applications in a Linux Docker Container with Visual Studio appeared first on C++ Team Blog.

Debugging Linux CMake Projects with gdbserver

$
0
0

Gdbserver is a program that allows you to remotely debug applications running on Linux. It is especially useful in embedded scenarios where your target system may not have the resources to run the full gdb.

Visual Studio 2019 version 16.5 Preview 1 enables remote debugging of CMake projects with gdbserver. In our previous blog post we showed you how to build a CMake application in a Linux docker container. In this post we’re going expand on that set-up to achieve the following workflow:

  1. Cross-compile for ARM in our Linux docker container
  2. Copy the build output back to our local machine
  3. Deploy the program to a separate ARM Linux system (connected over SSH) and debug using gdbserver on the ARM Linux system and a local copy of gdb

This allows you to leverage a specific version of gdb on your local machine and avoid running the full client on your remote system.

Support for this workflow in Visual Studio 2019 version 16.5 Preview 1 is still experimental and requires some manual configuration. Feedback on how you’re using these capabilities and what more you’d like to see is welcome.

Cross-compile a CMake project for ARM

This post assumes you are have already configured Visual Studio 2019 to build a CMake project in a Linux docker container (Ubuntu). Check out our previous post Build C++ Applications in a Linux Docker Container with Visual Studio for more information. However, nothing about this workflow is specific to Docker, so you can follow the same steps to configure any Linux environment (a VM, a remote Linux server, etc.) for build.

The first thing we will do is modify our build to cross-compile for ARM. I’ve created a new Dockerfile based on the image defined in my previous post.

# our local base image created in the previous post
FROM ubuntu-vs

LABEL description="Container to cross-compile for ARM with Visual Studio"

# install new build dependencies (cross-compilers)
RUN apt-get update && apt-get install -y gcc-arm-linux-gnueabi g++-arm-linux-gnueabi

# copy toolchain file from local Windows filesystem to
# Linux container (/absolute/path/)
COPY arm_toolchain.cmake /opt/toolchains/

In this Dockerfile I acquire my cross-compilers and copy a CMake toolchain file from my local Windows filesystem to my Linux Docker container. CMake is also a dependency but I will deploy statically linked binaries directly from Visual Studio in a later step.

CMake toolchain files specify information about compiler and utility paths. I used the example provided by CMake to create a toolchain file on Windows with the following content.

set(CMAKE_SYSTEM_NAME Linux)
set(CMAKE_SYSTEM_PROCESSOR arm)
set(CMAKE_C_COMPILER /usr/bin/arm-linux-gnueabi-gcc)
set(CMAKE_CXX_COMPILER /usr/bin/arm-linux-gnueabi-g++)

Save your toolchain file as ‘arm_toolchain.cmake’ in the directory where your new Dockerfile is saved. Alternatively, you can specify the path to the file relative to the build context as a part of the COPY command.

We can now build an image based on our new Dockerfile and run a container derived from the image:

> docker build -t ubuntu-vs-arm .
> docker run -p 5000:22 -i -t ubuntu-vs-arm /bin/bash

Lastly, we will interact with our docker container directly to start SSH and create a user account to use with our SSH connection.  Again, note that you can enable root login and start SSH from your Dockerfile if you want to avoid any manual and container-specific configuration. Replace <user-name> with the username you would like to use and run:

> service ssh start
> useradd -m -d /home/<user-name> -s /bin/bash -G sudo <user-name>
> passwd <user-name>

You are now ready to build from Visual Studio.

Configure CMake Settings in Visual Studio to cross-compile for ARM

Make sure you have Visual Studio 2019 version 16.5 Preview 1 or later and the Linux development with C++ workload installed. Open Visual Studio and create a new CMake project or open the sample application created in our previous post.

We will then create a new CMake configuration in Visual Studio. Navigate to the CMake Settings Editor and create a new “Linux-Debug” configuration. We will make the following modifications to cross-compile for ARM:

  1. Change the configuration name to arm-Debug (this does not affect build, but will help us reference this specific configuration)
  2. Ensure the remote machine name is set to your Linux docker container
  3. Change the toolset to linux_arm
  4. Specify the full path to your toolchain file on your Linux docker container (/opt/toolchains/arm_toolchain.cmake) as a CMake toolchain file.
  5. Navigate to the underlying CMakeSettings.json file by selecting ‘CMakeSettings.json’ in the description at the top of the editor. In your arm-Debug configuration, set “remoteCopyBuildOutput”: true. This will copy the output of your build back to your local machine for debugging with gdb.

Note that whenever your change your compilers you will need to delete the cache of the modified configuration (Project > CMake Cache (arm-Debug only) > Delete Cache) and reconfigure. If you don’t already have CMake installed, then Visual Studio will prompt you to deploy statically linked binaries directly to your remote machine as a part of the configure step.

Your CMake project is now configured to cross-compile for ARM on your Linux docker container. Once you build the program the executable should be available on both your build system (/home/<user-name>/.vs/…) and your local Windows machine.

Add a second remote connection

Next, I will add a new remote connection to the connection manager. This is the system I will be deploying to and has OS Raspbian (ARM). Make sure ssh is running on this system.

Note: The ability to separate your build system from your deploy system in Visual Studio 2019 version 16.5 Preview 1 does not yet support Visual Studio’s native support for WSL. It also does not support more than one connection to ‘localhost’ in the connection manager. This is due to a bug that will be resolved in the next release of Visual Studio. For this scenario, your docker connection should be the only connection with host name ‘localhost’ and your ARM system should be connected over SSH.

Configure launch.vs.json to debug using gdbserver

Finally, we will configure the debugger. Right-click on the root CMakeLists.txt, click on “Debug and Launch Settings” and select debugger type C/C++ Attach for Linux (gdb). We will manually configure this file (including adding and removing properties) to use gdbserver and a local copy of gdb. My launch file with inline comments is below. Again, this support is new and still requires quite a bit of manual configuration:

{
  "version": "0.2.1",
  "defaults": {},
  "configurations": [
    {
      "type": "cppdbg",
      "name": "gdbserver", // a friendly name for the debug configuration 
      "project": "CMakeLists.txt",
      "projectTarget": "CMakeProject134", // target to invoke, must match the name of the target that exists in the debug drop-down menu
      "cwd": "${workspaceRoot}", // some local directory 
      "program": "C:\\Users\\demo\\source\\repos\\CMakeProject134\\out\\build\\arm-Debug\\CMakeProject134", // full Windows path to the program
      "MIMode": "gdb",
      "externalConsole": true,
      "remoteMachineName": "-1483267367;10.101.11.101 (username=test, port=22, authentication=Password)", // remote system to deploy to, you can force IntelliSense to prompt you with a list of existing connections with ctrl + space
      "miDebuggerPath": "C:\\Program Files (x86)\\Microsoft Visual Studio\\2019\\Enterprise\\Common7\\IDE\\VC\\Linux\\bin\\gdb\\8.1\\arm-linux-gnueabihf-gdb.exe", // full Windows path to local instance of gdb
      "setupCommands": [
        {
          "text": "set sysroot ." 
        },
        {
          "text": "-enable-pretty-printing",
          "ignoreFailures": true
        }
      ],
      "visualizerFile": "${debugInfo.linuxNatvisPath}",
      "showDisplayString": true,
      "miDebuggerServerAddress": "10.101.11.101:1234", // host name of the remote deploy system and port gdbserver will listen on
      "remotePrelaunchCommand": "gdbserver :1234 /home/test/.vs/CMakeProject134/66f2462c-6a67-40f0-8b92-34f6d03b072f/out/build/arm-Debug/CMakeProject134/CMakeProject134 >& /dev/null", // command to execute on the remote system before gdb is launched including the full path to the output on your remote debug system, >& /dev/null is required
      "remotePrelaunchWait": "2000" // property to specify a wait period after running the prelaunchCommand and before launching the debugger in ms
    }
  ]
}

Now set a breakpoint and make sure arm-Debug is your active CMake configuration and gdbserver is your active debug configuration.

Make sure arm-Debug is your active CMake configuration and gdbserver is your active debug configuration.

When you press F5 the project will build on the remote system specified in CMakeSettings.json, be deployed to the remote system specified in launch.vs.json, and a local debug session will be launched.

Troubleshooting tips:

  1. If your launch configuration is configured incorrectly then you may be unable to connect to your remote debug machine. Make sure to kill any lingering gdbserver processes on the system you are deploying to before attempting to reconnect.
  2. If you do not change your remote build root in CMake Settings, then the relative path to the program on your remote debug machine is the same as the relative path to the program on your remote build machine from ~/.vs/…
  3. You can enable cross-platform logging (Tools > Options > Cross Platform > Logging) to view the commands executed on your remote systems.

Give us your feedback

Do you have feedback on our Linux tooling or CMake support in Visual Studio? We’d love to hear from you to help us prioritize and build the right features for you. We can be reached via the comments below, Developer Community (you can “Suggest a Feature” to give us new ideas), email (visualcpp@microsoft.com), and Twitter (@VisualC). The best way to suggest new features or file bugs is via Developer Community.

The post Debugging Linux CMake Projects with gdbserver appeared first on C++ Team Blog.

Viewing all 1541 articles
Browse latest View live


<script src="https://jsc.adskeeper.com/r/s/rssing.com.1596347.js" async> </script>