Quantcast
Channel: C++ Team Blog
Viewing all 1541 articles
Browse latest View live

SIMD Extension to C++ OpenMP in Visual Studio

$
0
0

In the era of ubiquitous AI applications there is an emerging demand of the compiler accelerating computation-intensive machine-learning code for existing hardware. Such code usually does mathematical computation like matrix transformation and manipulation and it is usually in the form of loops. The SIMD extension of OpenMP provides users an effortless way to speed up loops by explicitly leveraging the vector unit of modern processors. We are proud to start offering C/C++ OpenMP SIMD vectorization in Visual Studio 2019.

The OpenMP C/C++ application program interface was originally designed to improve application performance by enabling code to be effectively executed in parallel on multiple processors in the 1990s. Over the years the OpenMP standard has been expanded to support additional concepts such as task-based parallelization, SIMD vectorization, and processor offloading. Since 2005, Visual Studio has supported the OpenMP 2.0 standard which focuses on multithreaded parallelization. As the world is moving into an AI era, we see a growing opportunity to improve code quality by expanding support of the OpenMP standard in Visual Studio. We continue our journey in Visual Studio 2019 by adding support for OpenMP SIMD.

OpenMP SIMD, first introduced in the OpenMP 4.0 standard, mainly targets loop vectorization. It is so far the most widely used OpenMP feature in machine learning according to our research. By annotating a loop with an OpenMP SIMD directive, the compiler can ignore vector dependencies and vectorize the loop as much as possible. The compiler respects users’ intention to have multiple loop iterations executed simultaneously.

#pragma omp simd 
for (i = 0; i < count; i++) 
{ 
    a[i] = b[i] + 1; 
}

As you may know, C++ in Visual Studio already provides similar non-OpenMP loop pragmas like #pragma vector and #pragma ivdep. However, the compiler can do more with OpenMP SIMD. For example:

  1. The compiler is always allowed to ignore any vector dependencies that are present.
  2. /fp:fast is enabled within the loop.
  3. Loops with function calls are vectorizable.
  4. Outer loops are vectorizable.
  5. Nested loops can be coalesced into one loop and vectorized.
  6. Hybrid acceleration is achievable with #pragma omp for simd to enable coarse-grained multithreading and fine-grained vectorization.

In addition, the OpenMP SIMD directive can take the following clauses to further enhance the vectorization:

  • simdlen(length) : specify the number of vector lanes
  • safelen(length) : specify the vector dependency distance
  • linear(list[ : linear-step]) : the linear mapping from loop induction variable to array subscription
  • aligned(list[ : alignment]): the alignment of data
  • private(list) : specify data privatization
  • lastprivate(list) : specify data privatization with final value from the last iteration
  • reduction(reduction-identifier : list) : specify customized reduction operations
  • collapse(n) : coalescing loop nest

New -openmp:experimental switch

An OpenMP-SIMD-annotated program can be compiled with a new CL switch -openmp:experimental. This new switch enables additional OpenMP features not available under -openmp. While the name of this switch is “experimental”, the switch itself, and the functionality it enables is fully supported and production-ready. The name reflects that it doesn’t enable any complete subset or version of an OpenMP standard. Future iterations of the compiler may use this switch to enable additional OpenMP features and new OpenMP-related switches may be added. The -openmp:experimental switch subsumes the -openmp switch which means it is compatible with all OpenMP 2.0 features. Note that the SIMD directive and its clauses cannot be compiled with the -openmp switch.

For loops that are not vectorized, the compiler will issue a message for each of them like below. For example,

cl -O2 -openmp:experimental mycode.cpp

mycode.cpp(84) : info C5002: Omp simd loop not vectorized due to reason ‘1200’

mycode.cpp(90) : info C5002: Omp simd loop not vectorized due to reason ‘1200’

For loops that are vectorized, the compiler keeps silent unless a vectorization logging switch is provided:

cl -O2 -openmp:experimental -Qvec-report:2 mycode.cpp

mycode.cpp(84) : info C5002: Omp simd loop not vectorized due to reason ‘1200’

mycode.cpp(90) : info C5002: Omp simd loop not vectorized due to reason ‘1200’

mycode.cpp(96) : info C5001: Omp simd loop vectorized

As the first step of supporting OpenMP SIMD we have basically hooked up the SIMD pragma with the backend vectorizer under the new switch. We focused on vectorizing innermost loops by improving the vectorizer and alias analysis. None of the SIMD clauses are effective in Visual Studio 2019 at the time of this writing. They will be parsed but ignored by the compiler with a warning issued for user’s awareness. For example, the compiler will issue

warning C4849: OpenMP ‘simdlen’ clause ignored in ‘simd’ directive

for the following code:

#pragma omp simd simdlen(8)
for (i = 1; i < count; i++)
{
    a[i] = a[i-1] + 1;
    b[i] = *c + 1;
    bar(i);
}

More about the semantics of OpenMP SIMD directive

The OpenMP SIMD directive provides users a way to dictate the compiler to vectorize a loop. The compiler is allowed to ignore the apparent legality of such vectorization by accepting users’ promise of correctness. It is users’ responsibility when unexpected behavior happens with the vectorization. By annotating a loop with the OpenMP SIMD directive, users intend to have multiple loop iterations executed simultaneously. This gives the compiler a lot of freedom to generate machine code that takes advantage of SIMD or vector resources on the target processor. While the compiler is not responsible for exploring the correctness and profit of such user-specified parallelism, it must still ensure the sequential behavior of a single loop iteration.

For example, the following loop is annotated with the OpenMP SIMD directive. There is no perfect parallelism among loop iterations since there is a backward dependency from a[i] to a[i-1]. But because of the SIMD directive the compiler is still allowed to pack consecutive iterations of the first statement into one vector instruction and run them in parallel.

#pragma omp simd
for (i = 1; i < count; i++)
{
    a[i] = a[i-1] + 1;
    b[i] = *c + 1;
    bar(i);
}

Therefore, the following transformed vector form of the loop is legal because the compiler keeps the sequential behavior of each original loop iteration. In other words, a[i] is executed after a[-1], b[i] is after a[i] and the call to bar happens at last.

#pragma omp simd
for (i = 1; i < count; i+=4)
{
    a[i:i+3] = a[i-1:i+2] + 1;
    b[i:i+3] = *c + 1;
    bar(i);
    bar(i+1);
    bar(i+2);
    bar(i+3);
}

It is illegal to move the memory reference *c out of the loop if it may alias with a[i] or b[i]. It’s also illegal to reorder the statements inside one original iteration if it breaks the sequential dependency. As an example, the following transformed loop is not legal.

c = b;
t = *c;
#pragma omp simd
for (i = 1; i < count; i+=4)
{
    a[i:i+3] = a[i-1:i+2] + 1;
    bar(i);            // illegal to reorder if bar[i] depends on b[i]
    b[i:i+3] = t + 1;  // illegal to move *c out of the loop
    bar(i+1);
    bar(i+2);
    bar(i+3);
}


Future Plans and Feedback

We encourage you to try out this new feature. As always, we welcome your feedback. If you see an OpenMP SIMD loop that you expect to be vectorized, but isn’t or the generated code is not optimal, please let us know. We can be reached via the comments below, via email (visualcpp@microsoft.com), twitter (@visualc) , or via Developer Community.

Moving forward, we’d love to hear your need of OpenMP functionalities missing in Visual Studio. As there have been several major evolutions in OpenMP since the 2.0 standard, OpenMP now has tremendous features to ease your effort to build high-performance programs. For instance, task-based concurrency programming is available starting from OpenMP 3.0. Heterogenous computing (CPU + accelerators) is supported in OpenMP 4.0. Advanced SIMD vectorization and DOACROSS loop parallelization support are also available in the latest OpenMP standard now. Please check out the complete standard revisions and feature sets from the OpenMP official website: https://www.openmp.org. We sincerely ask for your thoughts on the specific OpenMP features you would like to see. We’re also interested in hearing about how you’re using OpenMP to accelerate your code. Your feedback is critical that it will help drive the direction of OpenMP support in Visual Studio.


The post SIMD Extension to C++ OpenMP in Visual Studio appeared first on C++ Team Blog.


Visual Studio Code C/C++ extension: March 2019 Update

$
0
0

The March 2019 update of the Visual Studio Code C/C++ extension is now available. This release includes many new features and bug fixes, including IntelliSense caching, Build and Debug Active File, and configuration squiggles. For a full list of this release’s improvements, check out our release notes on GitHub.

IntelliSense Cache (AutoPCH)

The extension will now cache header information to improve IntelliSense speed. This is similar to precompiled header files in Visual Studio. Please note that IntelliSense caching works on Linux, macOS 10.13+ (High Sierra and later versions), and Windows.

Precompiled Headers (PCH)

Precompiled headers (PCH) can be used with compilers  to speed up build times by taking the #include header files in your code and compiling them for reuse later. Without precompiling headers, IntelliSense needs to process the header files and source code. But, if your header files do not change, it is not actually necessary to process the header files again.

With AuotPCH, the IntelliSense compiler will generate a separate PCH for the use of the IntelliSense compiler. Caching of  PCH files reduces the parsing time of #include header files to improve IntelliSense performance.

IntelliSense Cache Settings

By default, the cached PCH files are currently stored in your workspace folder’s “.vscode” folder under the subdirectory ‘ipch’.  You change this location via the “C_Cpp.intelliSenseCachePath” setting. You can also control how much disk space can be used for the cache with the “C_Cpp.intelliSenseCacheSize” setting. The cached PCH files can be large, depending on the size and number of #include header files. The default cache size (for all files under the C_Cpp.intelliSenseCachePath) is 5120 MB. IntelliSense caching can be disabled by setting the cache size to 0.

Build and Debug Active File

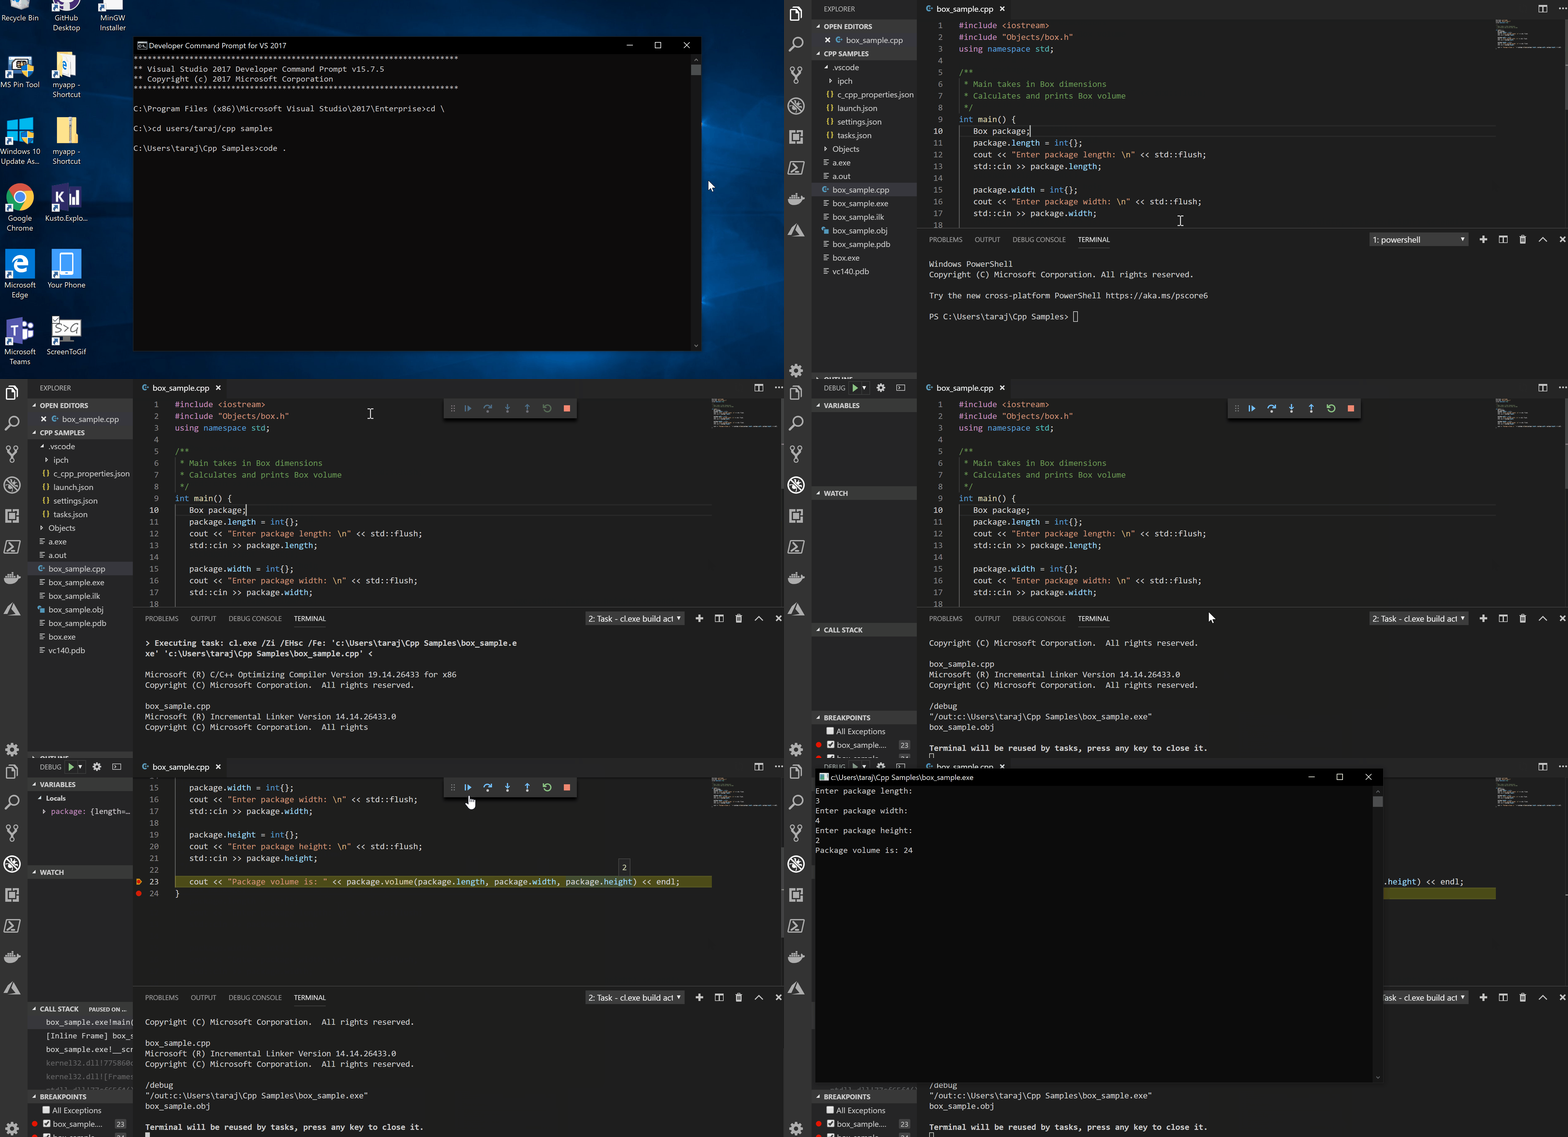
To simplify the build and debug  experience with the C/C++ extension, we added a command to help you generate build and debug tasks for single code files. We write out to your tasks.json and launch.json when you press F5 or select the command from the context menu , which automatically configures the tasks and kicks off a build and debug session . So, you no longer need to go through many of the configuration steps previously required to build and debug your active   Here’s an example with a simple project :

developer command prompt launches VS Code workspace folder. In VS Code open a file and right click in the editor window to see the "build and debug active file" menu option. Selecting the menu option starts a debugger session on the active file.

Please Note: Since this feature writes out tasks.json and launch.json files, it currently requires that a workspace folder be opened first. Using this command will remove comments from the tasks.json and launch.json files. If you are on Windows and wish to use the cl.exe compiler through Visual Studio, you need to open the workspace folder and launch Visual Studio Code from the Developer Command Prompt using the “code .” command.

Configuration Squiggles

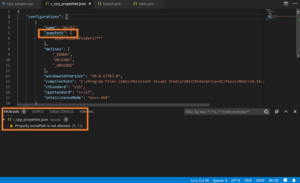
On our path to improving the configuration experience, we added additional validation to the c_cpp_properties.json file to assist in diagnosing potential configuration mistakes. These validation checks can be seen with error squiggles . The error squiggles are shown for invalid paths for properties like includePath and compilerPath. We also show error squiggles when a folder is used instead of a file or vice versa. The detected issues will also show up as “Problems” in the problems window:

Changing compiler path to "somePath" generates an error quiggle in the intellisense for the c_cpp_properties.json config file

We will continue improving the configuration experience in future releases.

Tell Us What You Think

Download the C/C++ extension for Visual Studio Code, give it a try, and let us know what you think. If you run into any issues, or have any suggestions, please report them on the  section of our GitHub repository. Set the C_CppProperties.UpdateChannel in your Visual Studio Code settings to “Insiders” to get early builds of our extension. to get early builds of our extension.

Please also take our quick survey to help us shape this extension to meet your needs. We can be reached via the comments below or via email (visualcpp@microsoft.com). You can also find our team on Twitter (@VisualC).

The post Visual Studio Code C/C++ extension: March 2019 Update appeared first on C++ Team Blog.

In-Editor Documentation for CMake in Visual Studio

$
0
0

Visual Studio 2019 version 16.1 Preview 1 introduces in-editor documentation for CMake commandsvariables, and properties. You can now leverage IntelliSense autocompletion and quick info tooltips when editing a CMakeLists.txt file, which will save you time spent outside of the IDE referencing documentation and make the process less error-prone. If you are just getting started with our native support for CMake, head over to our CMake Support in Visual Studio introductory page. You can use CMake to target multiple platforms from the comfort of a single IDE. 

Quick info 

Visual Studio now provides tooltips for CMake commands, variables, and properties based on official CMake documentation. The tooltip appears when hovering over a command, variable, or property name and includes the definition (with optional arguments) and a quick description. Below is the quick info seen when hovering over the add_subdirectory  project command. 

Quick Info for "add_subdirectory" CMake command

IntelliSense completion 

Visual Studio 2019 version 16.1 also improves completion behavior in CMakeLists.txt and provides suggestions for documented CMake commands, variables, and properties. Below are the completion suggestions and tooltips provided when setting the CMAKE_CXX_STANDARD using the set command and CMAKE_CXX_STANDARD variable.  

Completion suggestions and tooltips provided when setting the CMAKE_CXX_STANDARD using the set  command and CMAKE_CXX_STANDARD  variable

Give us your feedback!

Thank you for taking the time to provide the feedback that we use to shape Visual Studio 2019 into the best developer environment for you. We’d love for you to download Visual Studio 2019 version 16.1 Preview 1 and give it a try. We can be reached via the comments below or via email (visualcpp@microsoft.com). If you encounter other problems with Visual Studio or MSVC or have a suggestion, you can use the Report a Problem tool in Visual Studio or head over to the Visual Studio Developer Community. You can also find us on Twitter (@VisualC). 

The post In-Editor Documentation for CMake in Visual Studio appeared first on C++ Team Blog.

Visual Studio Code now available through Particle Workbench

$
0
0

We’re excited to announce that Visual Studio Code is included in the new release of tooling for Particle IoT developers. Developers using the Particle platform can now use Visual Studio Code as their default editor for building IoT apps!

Particle provides a widely-used IoT platform that consists of hardware, software, and connectivity. At their Spectra conference last year, Particle announced Particle Workbench, a professional IoT developer offering that includes Visual Studio Code.

Particle logo

Particle Workbench and Visual Studio Code provide a free, ready to use experience to develop, program, and debug apps on Particle’s IoT platform, as well as Microsoft Azure.

Particle Workbench and Visual Studio Code are available together through a single, downloadable installer, which include the toolchains and extensions for Particle’s IoT ecosystem, supporting local offline compilation and device programming, or cloud compilation and over-the-air (OTA) device programming. IntelliSense for Particle Device APIs are provided by Visual Studio Code language services and the C/C++ extension. Advanced hardware debugging is available in Visual Studio Code, for actions like setting breakpoints and step-through debugging, all pre-configured for Particle hardware. There’s also access to more than 3,000 official and community Particle libraries, enabling more reusability and less typing.

For more information, take a look at Particle’s announcement. And if you’re interested to learn more about how to use Particle with Microsoft Azure, learn how to create the dashboard of your dreams in this post from Paul DeCarlo.

Happy coding!

The post Visual Studio Code now available through Particle Workbench appeared first on C++ Team Blog.

Accelerating Compute-Intensive Workloads with Intel® AVX-512

$
0
0

This guest post was authored by Junfeng Dong, John Morgan, and Li Tian from Intel Corporation.

Introduction

Last year we introduced Intel® Advanced Vector Extensions 512 (Intel® AVX-512) support in Microsoft* Visual Studio* 2017 through this VC++ blog post. In this follow-on post, we cover some examples to give you a taste of how Intel® AVX-512 provides performance benefits. These examples include calculating the average of an array, matrix vector multiplication, and the calculation of the Mandelbrot set. Microsoft Visual Studio 2017 version 15.5 or later (we recommend the latest) is required to compile these demos, and a computer with an Intel® processor which supports the Intel® AVX-512 instruction set is required to run them. See our ARK web site for a list of the processors.

Test System Configuration

Here is the hardware and software configuration we used for compiling and running these examples:

  • Processor: Intel® Core™ i9 7980XE CPU @ 2.60GHz, 18 cores/36 threads
  • Memory: 64GB
  • OS: Windows 10 Enterprise version 10.0.17134.112
  • Power option in Windows: Balanced
  • Microsoft Visual Studio 2017 version 15.8.3

Note: The performance of any modern processor depends on many factors, including the amount and type of memory and storage, the graphics and display system, the particular processor configuration, and how effectively the program takes advantage of it all. As such, the results we obtained may not exactly match results on other configurations.

Sample Walkthrough: Array Average

Let’s walk through a simple example of how to write some code using Intel® AVX-512 intrinsic functions. As the name implies, Intel® Advanced Vector Extensions (Intel® AVX) and Intel® AVX-512 instructions are designed to enhance calculations using computational vectors, which contain several elements of the same data type. We will use these AVX and AVX-512 intrinsic functions to speed up the calculation of the average of an array of floating point numbers.

First we start with a function that calculates the average of array “a” using scalar (non-vector) operations:

static const int length = 1024*8;
static float a[length];
float scalarAverage() {
  float sum = 0.0;
  for (uint32_t j = 0; j < _countof(a); ++j) {
    sum += a[j];
  }
  return sum / _countof(a);

This routine sums all the elements of the array and then divides it by the number of elements. To “vectorize” this calculation we break the array into groups of elements or “vectors” that we can calculate simultaneously. For Intel® AVX we can fit 8 float elements in each vector, as each float is 32 bits and the vector is 256 bits, so 256/32 = 8 float elements. We sum all the groups into a vector of partial sums, and then add the elements of that vector to get the final sum. For simplicity, we assume that the number of elements is a multiple of 8 or 16 for AVX and AVX-512, respectively, in the sample code shown below. If the number of total elements doesn’t cleanly fit into these vectors, you would have to write a special case to handle the remainder.

Here is the new function:

float avxAverage () {
  __m256 sumx8 = _mm256_setzero_ps();
  for (uint32_t j = 0; j < _countof(a); j = j + 8) {
    sumx8 = _mm256_add_ps(sumx8, _mm256_loadu_ps(&(a[j])));
  }
  float sum = sumx8.m256_f32[0] + sumx8.m256_f32[1] +
  sumx8.m256_f32[2] + sumx8.m256_f32[3] +
  sumx8.m256_f32[4] + sumx8.m256_f32[5] +
  sumx8.m256_f32[6] + sumx8.m256_f32[7];
  return sum / _countof(a);
}

Here, _mm256_setzero_ps creates a vector with eight zero values, which is assigned to sumx8. Then, for each set of eight contiguous elements from the array, _mm256_loadu_ps loads them into a 256-bit vector which _mm256_add_ps adds to the corresponding elements in sumx8, making sumx8 a vector of eight subtotals. Finally, these subtotals are added to create the total number.

Compared to the scalar implementation, this single instruction, multiple data (SIMD) implementation executes fewer add instructions. For an array with n elements, a scalar implementation will execute n add instructions, but using Intel® AVX only (n/8 + 7) add instructions are needed. As a result, Intel® AVX can potentially be up to 8X faster than the scalar implementation.

Similarly, here is the code for the Intel® AVX-512 version:

float avx512AverageKernel() {
  __m512 sumx16 = _mm512_setzero_ps();
  for (uint32_t j = 0; j < _countof(a); j = j + 16) {
    sumx16 = _mm512_add_ps(sumx16, _mm512_loadu_ps(&(a[j])));
  }
  float sum = _mm512_reduce_add_ps (sumx16);
  return sum / _countof(a);

As you can see, this version is almost identical to the previous function except for the way the final sum is calculated. With 16 elements in the vector, we would need 16 array references and 15 additions to calculate the final sum if we were to do it the same way as the AVX version. Fortunately, AVX-512 provides the _mm512_reduce_add_ps intrinsic function to generate the same result, which makes the code much easier to read. This function adds the first eight elements to the rest, then adds the first four of that vector to the rest, then two and finally sums those to get the total with just four addition instructions. Using Intel® AVX-512 to find the average of an array with n elements requires the execution of (n/16+4) addition instructions which is about half of what was needed for Intel® AVX when n is large. As a result, Intel® AVX-512 can potentially be up to 2x faster than Intel® AVX.

For this example, we used only a few of the most basic Intel® AVX-512 intrinsic functions, but there are hundreds of vector intrinsic functions available which perform various operations on a selection of different data types in 128-bit, 256-bit, and 512-bit vectors with options such as masking and rounding. These functions may use instructions from various Intel® instruction set extensions, including Intel® AVX-512. For example, the intrinsic function_mm512_add_ps() is implemented using the Intel® AVX-512 vaddps instruction. You can use the Intel Software Developer Manuals to learn more about Intel® AVX-512 instructions, and the Intel Intrinsics Guide to find particular intrinsic functions. Click on a function entry in the Intrinsics Guide and it will expand to show more details, such as Synopsis, Description, and Operation.

These functions are declared using the immintrin.h header. Microsoft also offers the intrin.h header, which declares almost all Microsoft Visual C++* (MSVC) intrinsic functions, including the ones from immintrin.h. You can include either of these headers in your source file.

Sample Walkthrough: Matrix Vector Multiplication

Mathematical vector and matrix arithmetic involves lots of multiplications and additions. For example, here is a simple multiplication of a matrix and a vector:

A computer can do this simple calculation almost instantly but multiplying very large vectors and matrices can take hundreds or thousands of multiplications and additions like this. Let’s see how we can “vectorize” those computations to make them faster. Let’s start with a scalar function which multiplies matrix t1 with vector t2:

static float *out;
static const int row = 16;
static const int col = 4096;
static float *scalarMultiply()
{
  for (uint64_t i = 0; i < row; i++)
  {
    float sum = 0;
    for (uint64_t j = 0; j < col; j++)
      sum = sum + t1[i * col + j] * t2[j];
    out[i] = sum;
  }
  return out;
}

As with the previous example, we “vectorize” this calculation by breaking each row into vectors. For AVX-512, because each float is 32 bits and a vector is 512 bits, a vector can have 512/32 = 16 float elements. Note that this is a computational vector, which is different from the mathematical vector that is being multiplied. For each row in the matrix we load 16 columns as well as the corresponding 16 elements from the vector, multiply them together, and add the products to a 16-element accumulator. When the row is complete, we can sum the accumulator elements to get an element of the result. Note that we can do this with Intel® AVX or Intel® Streaming SIMD Extensions (Intel® SSE) as well, and the maximum vector sizes with those extensions are 8 (256/32) and 4 (128/32) elements respectively.

A version of the multiply routine using Intel® AVX-512 intrinsic functions is shown here:

static float *outx16;
static float *avx512Multiply()
{
  for (uint64_t i = 0; i < row; i++)
  {
    __m512 sumx16 = _mm512_set1_ps(0.0);
    for (uint64_t j = 0; j < col; j += 16)
    {
      __m512 a = _mm512_loadu_ps(&(t1[i * col + j]));
      __m512 b = _mm512_loadu_ps(&(t2[j]));
      sumx16 = _mm512_fmadd_ps(a, b, sumx16);
    }
    outx16[i] = _mm512_reduce_add_ps(sum16);
  }
  return outx16;
}

You can see that many of the scalar expressions have been replaced by intrinsic function calls that perform the same operation on a vector.

We replace the initialization of sum to zero with a call of the _mm512_set1_ps() function that creates a vector with 16 zero elements and assign that to sumx16. Inside the inner loop we load 16 elements of t1 and t2 into vector variables a and b respectively using _mm512_loadu_ps(). The _mm512_fmadd_ps() function adds the product of each element in a and b to the corresponding elements in sumx16.

At the end of the inner loop we have 16 partial sums in sumx16 rather than a single sum. To calculate the final result we must add these 16 elements together using the _mm512_reduce_add_ps() function that we used in the array average example.

Floating-Point vs. Real Numbers

At this point we should note that this vectorized version does not calculate exactly the same thing as the scalar version. If we were doing all of this computation using mathematical real numbers it wouldn’t matter what order we add the partial products, but that isn’t true of floating-point values. When floating-point values are added, the precise result may not be representable as a floating-point value. In that case the result must be rounded to one of the two closest values that can be represented. The difference between the precise result and the representable result is the rounding error.

When computing the sum of products like this the calculated result will differ from the precise result by the sum of all the rounding errors. Because the vectorized matrix multiply adds the partial products in a different order from the scalar version the rounding errors for each addition can also be different. Furthermore, the _mm512_fmadd_ps() function does not round the partial products before adding them to the partial sums, so only the addition adds a rounding error. If the rounding errors differ between the scalar and vectorized computations the result may also differ. However, this doesn’t mean that either version is wrong. It just shows the peculiarities of floating-point computation.

Mandelbrot Set

The Mandelbrot set is the set of all complex numbers z for which the sequence defined by the iteration

z(0) = z, z(n+1) = z(n)*z(n) + z, n=0,1,2, …

remains bounded. This means that there is a number B such that the absolute value of all iterates z(n) never gets larger than B. The calculation of the Mandelbrot set is often used to make colorful images of the points that are not in the set where each color indicates how many terms are needed to exceed the bound. It is widely used as a sample to demonstrate vector computation performance. The kernel code of calculating the Mandelbrot set where B is 2.0 is available here.

static int mandel(float c_re, float c_im, int count)
{
  float z_re = c_re, z_im = c_im;
  int i;
  for (i = 0; i < count; ++i)
  {
    if (z_re * z_re + z_im * z_im > 4.f)
      break;
    float new_re = z_re * z_re - z_im * z_im;
    float new_im = 2.f * z_re * z_im;
    z_re = c_re + new_re;
    z_im = c_im + new_im;
  }
  return i;
}

Of course, it is impossible to evaluate every term of an infinite series, so this function evaluates no more than the number of terms specified by count, and we assume that if the series hasn’t diverged by that point, it isn’t going to. The value returned indicates how many terms did not diverge, and it is typically used to select a color for that point. If the function returns count the point is assumed to be in the Mandelbrot set.

We can vectorize this by replacing each scalar operation with a vector equivalent similar to the way we vectorized matrix vector multiplication. But a complication arises with the following source line: “if (z_re * z_re + z_im * z_im > 4.0f) break;”. How do you vectorize a conditional break?

In this instance we know that once the series exceeds the bound all later terms will also exceed it, so we can unconditionally continue calculating all elements until all of them have exceeded the bound or we have reached the iteration limit. We can handle the condition by using a vector comparison to mask the elements that have exceeded the bound and use that to update the results for the remaining elements. Here is the code for a version using Intel® Advanced Vector Extensions 2 (Intel® AVX2) functions.

/* AVX2 Implementation */
__m256i avx2Mandel (__m256 c_re8, __m256 c_im8, uint32_t max_iterations) {
  __m256 z_re8 = c_re8;
  __m256 z_im8 = c_im8;
  __m256 four8 = _mm256_set1_ps(4.0f);
  __m256 two8 = _mm256_set1_ps(2.0f);
  __m256i result = _mm256_set1_epi32(0);
  __m256i one8 = _mm256_set1_epi32(1);
  for (auto i = 0; i < max_iterations; i++) {
  __m256 z_im8sq = _mm256_mul_ps(z_im8, z_im8);
  __m256 z_re8sq = _mm256_mul_ps(z_re8, z_re8);
  __m256 new_im8 = _mm256_mul_ps(z_re8, z_im8);
  __m256 z_abs8sq = _mm256_add_ps(z_re8sq, z_im8sq);
  __m256 new_re8 = _mm256_sub_ps(z_re8sq, z_im8sq);
  __m256 mi8 = _mm256_cmp_ps(z_abs8sq, four8, _CMP_LT_OQ);
  z_im8 = _mm256_fmadd_ps(two8, new_im8, c_im8);
  z_re8 = _mm256_add_ps(new_re8, c_re8);
  int mask = _mm256_movemask_ps(mi8);
  __m256i masked1 = _mm256_and_si256(_mm256_castps_si256(mi8), one8);
  if (0 == mask)
    break;
    result = _mm256_add_epi32(result, masked1);
  }
return result;
}

The scalar function returns a value that represents how many iterations were calculated before the result diverged, so a vector function must return a vector with those same values. We compute that by first generating a vector mi8 that indicates which elements have not exceeded the bound. Each element of this vector is either all zero bits (if the test condition _CMP_LT_OQ is not true) or all one bits (if it is true). If that vector is all zero, then everything has diverged, and we can break out of the loop. Otherwise the vector value is reinterpreted as a vector of 32-bit integer values by _mm256_castps_si256, and then masked with a vector of 32-bit ones. That leaves us with a one value for every element that has not diverged and zeros for those that have. All that is left is to add that vector to the vector accumulator result.

The Intel® AVX-512 version of this function is similar, with one significant difference. The _mm256_cmp_ps function returns a vector value of type __m256. You might expect to use a _mm512_cmp_ps function that returns a vector of type __m512, but that function does not exist. Instead we use the _mm512_cmp_ps_mask function that returns a value of type __mmask16. This is a 16-bit value, where each bit represents one element of the vector. These values are held in a separate set of eight registers that are used for vectorized conditional execution. Where the Intel® AVX2 function had to calculate the values to be added to result explicitly, Intel® AVX-512 allows the mask to be applied directly to the addition with the _mm512_mask_add_epi32 function.

/* AVX512 Implementation */
__m512i avx512Mandel(__m512 c_re16, __m512 c_im16, uint32_t max_iterations) {
  __m512 z_re16 = c_re16;
  __m512 z_im16 = c_im16;
  __m512 four16 = _mm512_set1_ps(4.0f);
  __m512 two16 = _mm512_set1_ps(2.0f);
  __m512i one16 = _mm512_set1_epi32(1);
  __m512i result = _mm512_setzero_si512();
  for (auto i = 0; i < max_iterations; i++) {
    __m512 z_im16sq = _mm512_mul_ps(z_im16, z_im16);
    __m512 z_re16sq = _mm512_mul_ps(z_re16, z_re16);
    __m512 new_im16 = _mm512_mul_ps(z_re16, z_im16);
    __m512 z_abs16sq = _mm512_add_ps(z_re16sq, z_im16sq);
    __m512 new_re16 = _mm512_sub_ps(z_re16sq, z_im16sq);
    __mmask16 mask = _mm512_cmp_ps_mask(z_abs16sq, four16, _CMP_LT_OQ);
    z_im16 = _mm512_fmadd_ps(two16, new_im16, c_im16);
    z_re16 = _mm512_add_ps(new_re16, c_re16);
    if (0 == mask)
      break;
    result = _mm512_mask_add_epi32(result, mask, result, one16);
  }
  return result;
}

Each of the vectorized Mandelbrot calculations returns a vector instead of a scalar, and the value of each element is the same value that would have been returned by the original scalar function. You may have noticed that the returned value has a different type from the real and imaginary argument vectors. The arguments to the scalar function are type float, and the function returns an unsigned integer. The arguments to the vectorized functions are vector versions of float, and the return value is a vector that can hold 32-bit unsigned integers. If you need to vectorize a function that uses type double, there are vector types for holding elements of that type as well: __m128d, __m256d and __m512d. You may be wondering if there are vector types for other integer types such as signed char and unsigned short. There aren’t. Vectors of type __m128i, __m256i and __m512i are used for all integer elements regardless of size or signedness.

You can also convert or cast (reinterpret) vectors that hold elements of one type into a vector with elements of a different type. In the mandelx8 function the _mm256_castps_si256 function is used to reinterpret the __m256 result of the comparison function as a __m256i integer element mask for updating the result vector.

Performance of Intel® AVX-512

We measured the run time of the Mandelbrot, matrix vector multiplication, and array average kernel functions with Intel® AVX/AVX2 and Intel® AVX-512 intrinsic functions to compare the performance. The source code is compiled with “/O2”. On our test platform, Mandelbrot with Intel® AVX-512 is 1.77x1 faster than the Intel® AVX2 version. The sample code is available here. Array average (source code) is 1.91x1 faster and matrix vector multiplication (source code) is 1.80x1 faster compared to their AVX2 versions.

We previously stated that the performance achievable by Intel® AVX-512 should approximately double that of Intel® AVX2. We see that we don’t quite reach that number, and there are a few reasons why the speedup might not reach the expected value. One is that only the innermost loop of the calculation is sped up by the larger vector instructions, but the total execution time includes time spent executing outer loops and other overhead that did not speed up. Another potential reason is because the bandwidth of the memory system must be shared between all cores doing calculations, and this is a finite resource. When most of that bandwidth is being used, the processor can’t compute faster than the data becomes available.

Conclusions

We have presented several examples of how to vectorize array average and matrix vector multiplication as well as shown code for calculating the Mandelbrot set using Intel® AVX2 and Intel® AVX-512 functions. This code is a more realistic example of how to use Intel® AVX-512 than the sample code from our prior post. From data collected on our test platform, the Intel® AVX-512 code shows performance improvements between 77% and 91% when compared to Intel® AVX2.

Intel® AVX-512 fully utilizes Intel® hardware capabilities to improve performance by doubling the data that can be processed with a single instruction compared to Intel® AVX2. This capability can be used in artificial intelligence, deep learning, scientific simulations, financial analytics, 3D modeling, image/audio/video processing, and data compression. Use Intel® AVX-512 and unlock your application’s full potential.

No license (express or implied, by estoppel or otherwise) to any intellectual property rights is granted by this document.

Intel disclaims all express and implied warranties, including without limitation, the implied warranties of merchantability, fitness for a particular purpose, and non-infringement, as well as any warranty arising from course of performance, course of dealing, or usage in trade.

This document contains information on products, services and/or processes in development.  All information provided here is subject to change without notice. Contact your Intel representative to obtain the latest forecast, schedule, specifications and roadmaps.

The products and services described may contain defects or errors known as errata which may cause deviations from published specifications. Current characterized errata are available on request.

Copies of documents which have an order number and are referenced in this document may be obtained by calling 1-800-548-4725 or by visiting https://www.intel.com/content/www/us/en/design/resource-design-center.html.

Intel, the Intel logo, Core are trademarks of Intel Corporation in the U.S. and/or other countries.

*Other names and brands may be claimed as the property of others

© Intel Corporation.

§ (1) As provided in this document
§ Software and workloads used in performance tests may have been optimized for performance only on Intel microprocessors. Performance tests, such as SYSmark and MobileMark, are measured using specific computer systems, components, software, operations and functions. Any change to any of those factors may cause the results to vary. You should consult other information and performance tests to assist you in fully evaluating your contemplated purchases, including the performance of that product when combined with other products.
§ Configurations: Ran sample code on an Intel® desktop powered by Intel® Core™ i9 7980XE CPU @ 2.60GHz with 64 GB RAM running Windows 10 Enterprise version 10.0.17134.112
§ For more information go to  https://www.intel.com/content/www/us/en/benchmarks/benchmark.html


The post Accelerating Compute-Intensive Workloads with Intel® AVX-512 appeared first on C++ Team Blog.
C++17/20 Features and Fixes in Visual Studio 2019

$
0
0

Visual Studio 2019 version 16.0 is now available and is binary compatible with VS 2015/2017. In this first release of VS 2019, we’ve implemented more compiler and library features from the C++20 Working Paper, implemented more <charconv> overloads (C++17’s “final boss”), and fixed many correctness, performance, and throughput issues. Here’s a list of the C++17/20 compiler/library feature work and the library fixes. (As usual, many compiler bugs were also fixed, but they aren’t listed here; compiler fixes tend to be specific to certain arcane code patterns. We recently blogged about compiler optimization and build throughput improvements in VS 2019, and we maintain a documentation page about compiler conformance improvements in VS 2019.)

New Features:

  • Implemented P1164 from C++20 unconditionally. This changes std::create_directory to check whether the target was already a directory on failure. Previously, all ERROR_ALREADY_EXISTS type errors were turned into success-but-directory-not-created codes.
  • The iterator debugging feature has been taught to properly unwrap std::move_iterator. For example, std::copy(std::move_iterator<std::vector<int>::iterator>, std::move_iterator<std::vector<int>::iterator>, int*) can now engage our memcpy fast path.
  • The standard library’s macroized keyword enforcement <xkeycheck.h> was fixed to emit the actual problem keyword detected rather than a generic message, look for C++20 keywords, and avoid tricking IntelliSense into saying random keywords were macros.
  • We added LWG 2221‘s operator<<(std::ostream, nullptr_t) for writing nullptrs to streams.
  • Parallel versions of is_sorted, is_sorted_until, is_partitioned, set_difference, set_intersection, is_heap, and is_heap_until were implemented by Miya Natsuhara.
  • P0883 “Fixing atomic initialization”, which changes std::atomic to value-initialize the contained T rather than default-initializing it, was implemented (also by Miya) when using Clang/LLVM with our standard library. This is currently disabled for C1XX as a workaround for a bug in constexpr processing.
  • Implemented the “spaceship” three-way comparison operator from P0515 “Consistent comparison”, with partial support for the C++20 <compare> header as specified in P0768 (specifically, the comparison category types and common_comparison_category type trait, but not the comparison algorithms which are undergoing some redesign in WG21). (Implemented by Cameron DaCamara in the compiler.)
  • Implemented the new C++20 P1008 rules for aggregates: a type with a user-declared constructor – even when defaulted or deleted so as not to be user-provided – is not an aggregate. (Implemented by Andrew Marino in the compiler.)
  • Implemented the remove_cvref and remove_cvref_t type traits from P0550, which are handy for stripping reference-ness and cv-qualification but without decaying functions and arrays to pointers (which std::decay and std::decay_t do).
  • C++17 <charconv> floating-point to_chars() has been improved: shortest chars_format::fixed is 60-80% faster (thanks to Ulf Adams at Google for suggesting long division), and shortest/precision chars_format::hex is complete. Further performance improvements for shortest fixed notation have been implemented and will ship in a future VS 2019 update, along with the decimal precision overloads that will complete the <charconv> implementation.
  • C++20 P0941 feature-test macros are now completely supported in the compiler and STL, including __has_cpp_attribute implemented by Phil Christensen. As a reminder, the feature-test macros are always active (i.e. defined or not defined, depending on the availability of the feature in question) regardless of the Standard mode option selected, because making them conditional on /std:c++latest would largely defeat their purpose.

Correctness Fixes:

  • std::allocator<void>, std::allocator::size_type, and std::allocator::difference_type have been un-deprecated.
  • A spurious static_cast not called for by the standard that accidentally suppressed C4244 narrowing warnings was removed from std::string. Attempting to call std::string::string(const wchar_t*, const wchar_t*) will now properly emit C4244 “narrowing a wchar_t into a char.”
  • Fixed std::filesystem::last_write_time failing when attempting to change a directory’s last write time.
  • std::filesystem::directory_entry‘s constructor was changed to store a failed result, rather than throwing an exception, when supplied a nonexistent target path.
  • std::filesystem::create_directory‘s 2-parameter version was changed to call the 1-parameter version, as the underlying CreateDirectoryExW function would perform copy_symlink when the existing_p was a symlink.
  • std::filesystem::directory_iterator no longer fails when encountering a broken symlink.
  • std::filesystem::space now accepts relative paths.
  • std::filesystem::path::lexically_relative is no longer confused by trailing slashes, reported as LWG 3096.
  • Worked around CreateSymbolicLinkW rejecting paths with forward slashes in std::filesystem::create_symlink.
  • Worked around the POSIX deletion mode delete function existing on Windows 10 LTSB 1609 but not actually being capable of deleting files.
  • std::boyer_moore_searcher and std::boyer_moore_horspool_searcher‘s copy constructors and copy assignment operators now actually copy things.
  • The parallel algorithms library now properly uses the real WaitOnAddress family on Windows 8 and later, rather than always using the Windows 7 and earlier fake versions.
  • std::system_category::message() now trims trailing whitespace from the returned message.
  • Some conditions that would cause std::linear_congruential_engine to trigger divide by 0 have been fixed.
  • The iterator unwrapping machinery we first exposed for programmer-user integration in VS 2017 15.8 (as described in https://devblogs.microsoft.com/cppblog/stl-features-and-fixes-in-vs-2017-15-8/ ) no longer unwraps iterators derived from standard library iterators. For example, a user that derives from std::vector<int>::iterator and tries to customize behavior now gets their customized behavior when calling standard library algorithms, rather than the behavior of a pointer.
  • The unordered container reserve function now actually reserves for N elements, as described in LWG 2156.
  • Many STL internal container functions have been made private for an improved IntelliSense experience. Additional fixes to mark members as private are expected in subsequent releases of Visual C++.
  • Times passed to the concurrency library that would overflow (e.g. condition_variable::wait_for(seconds::max())) are now properly dealt with instead of causing overflows that changed behavior on a seemingly random 29-day cycle (when uint32_t milliseconds accepted by underlying Win32 APIs overflowed).
  • Exception safety correctness problems wherein the node-based containers like list, map, and unordered_map would become corrupted were fixed. During a propagate_on_container_copy_assignment or propagate_on_container_move_assignment reassignment operation, we would free the container’s sentinel node with the old allocator, do the POCCA/POCMA assignment over the old allocator, and then try to acquire the sentinel node from the new allocator. If this allocation failed, the container is corrupted and can’t even be destroyed, as owning a sentinel node is a hard data structure invariant. This was fixed to allocate the new sentinel node from the source container’s allocator before destroying the existing sentinel node.
  • The containers were fixed to always copy/move/swap allocators according to propagate_on_container_copy_assignment, propagate_on_container_move_assignment, and propagate_on_container_swap, even for allocators declared is_always_equal.
  • std::basic_istream::read was fixed to not write into parts of the supplied buffer temporarily as part of \r\n => \n processing. This gives up some of the performance advantage we gained in VS 2017 15.8 for reads larger than 4k in size, but efficiency improvements from avoiding 3 virtual calls per character are still present.
  • std::bitset‘s constructor no longer reads the ones and zeroes in reverse order for large bitsets.
  • When implementing P0083 “Splicing Maps And Sets”, we managed to overlook the fact that the merge and extract members of the associative containers should have overloads that accept rvalue containers in addition to the overloads that accept lvalue containers. We’ve rectified this oversight by implementing the rvalue overloads.
  • With the advent of the Just My Code stepping feature, we no longer need to provide bespoke machinery for std::function and std::visit to achieve the same effect. Removing that machinery largely has no user-visible effects, except that the compiler will no longer produce diagnostics that indicate issues on line 15732480 or 16707566 of <type_traits> or <variant>.
  • The <ctime> header now correctly declares timespec and timespec_get in namespace std in addition to declaring them in the global namespace.
  • We’ve fixed a regression in pair‘s assignment operator introduced when implementing LWG 2729 “Missing SFINAE on std::pair::operator=“; it now correctly accepts types convertible to pair again.
  • Fixed a minor type traits bug, where add_const_t etc. is supposed to be a non-deduced context (i.e. it needs to be an alias for typename add_const<T>::type, not const T).

Header Inclusion Restructuring:

The standard library’s physical design was substantially overhauled to avoid including headers when they are not necessary. A large number of customers want to use standard library containers but don’t want to use the iostreams and locales. However, the C++ standard library has a circular dependency among components:

  • Systems that depend on <locale> facets want to use std::string as part of their underlying implementations.
  • std::string wants a stream insertion operator, which depends on std::ostream, which depends on <locale>.
  • Historically our standard library worked around this problem by introducing a lower level header <xstring>, which defined std::string, but none of the other contents of <string>. <xstring> would be included by both <locale> components, and by <string>, restoring the directed dependency graph. However, this approach had a number of problems:
  • #include <string> needed to drag in all of the iostreams machinery to provide the stream insertion operator, even though most translation units wouldn’t use the stream insertion operator.
  • If someone included only <ostream> they got std::basic_string and std::ostream, but they did not get std::basic_string‘s stream insertion operator, the std::string typedef, or the string literals. Customers found this extremely confusing. For example, if one tried to stream insert a std::basic_string after including only <ostream>, the compiler would print an incredibly long diagnostic saying operator<< couldn’t be found, listing 26 unrelated overloads. Also, attempts to use std::string_literals, std::to_string, or other <string> components, would fail, which is confusing when std::basic_string was otherwise available.

In VS 2019, we resolve the circular reference completely differently. The stream insertion operator now finds the necessary ostream components using argument-dependent lookup, allowing us to provide it in the same place as string. This restores appropriate layering (of std::string below <locale> components), and makes it possible to use <string> without dragging in the entire mass of iostreams machinery.

If you have lots of .cpp files that include string and do something simple, for example:

#include <stdio.h>
#include <string>

void f(const std::string& s) {
  puts(s.c_str());
}

In VS 2017 15.9 this program takes 244 milliseconds to compile on a 7980XE test machine (average of 5 runs), while in VS 2019 16.0 it takes only 178 milliseconds (or about 73% of the time).

Moreover, seemingly unrelated headers like <vector> were pulled into this mess. For example, vector wants to throw std::out_of_range, which derives from std::runtime_error, which has a constructor that takes a std::string. We already had out-of-line functions for all throw sites, so the spurious include of <stdexcept> in <vector> was unnecessary and has been removed. The following program used to take 177 milliseconds to compile in VS 2017 15.9, but now only needs 151 milliseconds (85% of the time):

#include <vector>

void f(std::vector<int>& v) {
  v.push_back(42);
}

The one downside of this change is that several programs that were getting away with not including the correct headers may need to add #includes. If you were saying std::out_of_range before, you may need to #include <stdexcept>. If you were using a stream insertion operator, you may now need to #include <ostream>. This way, only translation units actually using <stdexcept> or <ostream> components pay the throughput cost to compile them.

Performance and Throughput Improvements:

  • if constexpr was applied in more places in the standard library for improved throughput and reduced code size in the copy family, permutations like reverse and rotate, and in the parallel algorithms library.
  • The STL now internally uses if constexpr to reduce compile times even in C++14 mode.
  • The runtime dynamic linking detection for the parallel algorithms library no longer uses an entire page to store the function pointer array, as marking this memory read-only was deemed no longer relevant for security purposes.
  • std::thread‘s constructor no longer waits for the thread to start, and no longer inserts so many layers of function calls between the underlying C library _beginthreadex and the supplied callable object. Previously std::thread put 6 functions between _beginthreadex and the supplied callable object, which has been reduced to only 3 (2 of which are just std::invoke). This also resolves an obscure timing bug where std::thread‘s constructor would hang if the system clock changed at the exact moment a std::thread was being created.
  • Fixed a performance regression in std::hash that we introduced when implementing std::hash<std::filesystem::path>.
  • Several places the standard library used to achieve correctness with catch blocks now use destructors instead. This results in better debugger interaction — exceptions you throw through the standard library in the affected locations will now show up as being thrown from their original throw site, rather than our rethrow. Not all standard library catch blocks have been eliminated; we expect the number of catch blocks to be reduced in subsequent releases of Visual C++.
  • Suboptimal codegen in std::bitset caused by a conditional throw inside a noexcept function was fixed by factoring out the throwing path.
  • The std::list and std::unordered_meow family use non-debugging iterators internally in more places.
  • Several std::list members were changed to reuse list nodes where possible rather than deallocating and reallocating them. For example, given a list<int> that already has a size of 3, a call to assign(4, 1729) will now overwrite the ints in the first 3 list nodes, and allocate one new list node with the value 1729, rather than deallocating all 3 list nodes and then allocating 4 new list nodes with the value 1729.
  • All locations the standard library was calling erase(begin(), end()) were changed to call clear() instead.
  • std::vector now initializes and erases elements more efficiently in certain cases.
  • <variant> has been refactored to make it more optimizer-friendly, resulting in smaller and faster generated code. Most notably, std::visit and the inliner have now become good friends.
  • We’ve applied clang-format to the STL’s headers for improved readability. (There were additional manual changes, e.g. adding braces to all control flow.)

Reporting Bugs:

Please let us know what you think about VS 2019. You can report bugs via the IDE’s Report A Problem and also via the web, at the Developer Community’s C++ tab.

Billy O’Neal, Casey Carter, and Stephan T. Lavavej

The post C++17/20 Features and Fixes in Visual Studio 2019 appeared first on C++ Team Blog.

Visual Studio C++ Template IntelliSense Populates Based on Instantiations in Your Code

$
0
0

Ever since we announced Template IntelliSense, you all have given us great suggestions. One very popular suggestion was to have the Template Bar auto-populate candidates based on instantiations in your code. In Visual Studio 2019 version 16.1 Preview 2, we’ve added this functionality via an “Add All Existing Instantiations” option in the Template Bar dropdown menu. The following examples are from the SuperTux codebase. 

The Template Bar dropdown menu now contains a new entry, “Add All Existing Instantiations”.


 Clicking the “Add All Existing Instantiations” option will populate the dropdown, so you no longer need to manually type entries. 


Additionally, similar to Find All References, a window at the bottom of the editor shows you where each instantiation was found, and what its arguments were. 


Talk to Us! 

We hope this update addresses the popular customer feedback we received on Template IntelliSense! We’d love for you to download Visual Studio 2019 version 16.1 Preview 2 and let us know what you think. We can be reached via the comments below or via email (visualcpp@microsoft.com). If you encounter other problems with Visual Studio or have other suggestions you can use the Report a Problem tool in Visual Studio or head over to the Visual Studio Developer Community. You can also find us on Twitter (@VisualC). 

The post Visual Studio C++ Template IntelliSense Populates Based on Instantiations in Your Code appeared first on C++ Team Blog.

Improved C++ IntelliCode now Ships with Visual Studio 2019

$
0
0

IntelliCode support for C++ previously shipped as an extension, but it is now an in-box component that installs with the “Desktop Development with C++” workload in Visual Studio 2019 16.1 Preview 2. Make sure that IntelliCode is active for C++ by enabling the “C++ base model” under Tools > Options > IntelliCode > General: 


This version of C++ IntelliCode also supports free-functions and has better accuracy. You can see the IntelliCode results starred at the top of the member list: 


Talk to Us! 

We’d love for you to download Visual Studio 2019 version 16.1 Preview 2 and enable IntelliCode for C++. We can be reached via the comments below or via email (visualcpp@microsoft.com). If you encounter other problems with Visual Studio or have other suggestions you can use the Report a Problem tool in Visual Studio or head over to the Visual Studio Developer Community. You can also find us on Twitter (@VisualC).  


The post Improved C++ IntelliCode now Ships with Visual Studio 2019 appeared first on C++ Team Blog.


Visual Studio CMake Support – Clang/LLVM, CMake 3.14, Vcpkg, and Performance Improvements

$
0
0

We’ve introduced a bunch of improvements to our CMake support in the latest preview of Visual Studio 2019 Update 1. The latest release includes Clang/LLVM support, CMake 3.14, better vcpkg integration, and many more enhancements. If you are not familiar with Visual Studio’s CMake support, check out how to get started.

Clang/LLVM Support

Visual Studio now supports Clang/LLVM for CMake projects and you can now use Clang to target Windows and remote Linux machines. Full IntelliSense is supported along with Visual Studio’s comprehensive debugging support. Check out our Clang/LLVM post for much more information.

Install the “Clang compiler for Windows” optional component as part of the “Desktop development with C++” workload.

CMake 3.14 with Performance Improvements and Visual Studio 2019 Generator

We’ve updated the version of CMake that ships with Visual Studio to 3.14. This version includes the latest MSBuild generators that support Visual Studio 2019. You can learn more about what’s new in CMake 3.14 in CMake’s release notes.

Microsoft also worked with the CMake community to bring a new way of interfacing IDEs with CMake in 3.14 that replaces CMake server mode. What this means for you, is that many CMake operations (especially configuration) will be faster from now on. If you are interested in learning more about this, we are going to be writing a whole post about this soon.

Better Vcpkg Integration

In our first release of Visual Studio 2019 we introduced basic integration with vcpkg. In the latest preview we have enhanced with better integration with IntelliSense. Now, when you are adding a header for a missing library, we will recommend how to install it with vcpkg if it is available. There is also now IntelliSense for CMake’s “find_package” directive:

Install the “Clang compiler for Windows” optional component as part of the “Desktop development with C++” workload.

Simpler CMake Build and Install Roots

With Visual Studio 2019 version 16.1 Preview 2 we have updated the default build and install roots for local and remote CMake projects to be more in-line with the standard set by open-source CMake projects. When you create a new CMake project in Visual Studio using the “CMake Project” template, or add a new configuration to an existing project, the following build and install roots will be used. You can change these properties at any time by modifying the “Build root” and “Install root” (or “Remote build root” and “Remote install root”) properties of the CMake Settings Editor.

Local CMake Projects:

Build root: ${projectDir}\\out\\build\\${name}
Install root: ${projectDir}\\out\\install\\${name}

Remote CMake Projects:

Remote build root: $HOME/.vs/${projectDirName}/${workspaceHash}/out/build/${name}
Remote install root: $HOME/.vs/${projectDirName}/${workspaceHash}/out/install/${name}

All of the macros used in CMakeSettings.json can be referenced here. In these file paths:

  • ${projectDir} is the full path to the folder of the root CMakeLists.txt file
  • ${name} is the name of the configuration
  • ${projectDirName} is the name of the root directory (similar to ${projectDir} but omits the rest of the path)
  • ${workspaceHash} is a hash of the workspace location. It is used because project names are not guaranteed to be unique across directories.

These changes also resolve an issue with the old default build/install roots for Linux projects where you would see a mkdir failure if there was no write access to the folder (/var/tmp/…).

Changes to the Default CMake Configuration

Previously, new CMake projects in Visual Studio would create a default configuration that was never saved to disc. Now Visual Studio will create a default “x64-Debug” or “x86-Debug” configuration that matches the bitness of your machine and persists like a normal configuration.

Enhanced Customizability for Importing Existing Caches

We’ve added a new way to customize how existing caches are imported into Visual Studio. Previously, the IDE would re-run CMake with its initial settings to refresh the cache and build tree if you made changes to the CMake projects. You can now replace that behavior with any custom script or executable that drives the recreation of the CMake cache. If your project drives CMake with external scripts or custom tools, you can now fully integrate it with the IDE. Edit, build, and debug your complex codebases without having to leave the IDE and go back to the command line.

To use this feature, just set “cacheGenerationCommand” to the command line of your script or tool in your CMakeSettings.json file:

Cache generation command in CMakeSettings.json using a Python script to invoke CMake.

Logging for Remote Connections in Visual Studio

With Visual Studio 2019 you can develop C++ for both Linux and Windows from the comfort of a single IDE. In Visual Studio 2019 version 16.1 Preview 2 we have added logging for SSH connections to remote systems. This makes it easier to diagnose issues with remote connections and provides full transparency into what commands are being executed on your remote machine. Logs include connections, all commands sent to the remote machine (their text, exit code and execution time), and writes from Visual Studio to the shell.

Logging works for any cross-platform CMake project or MSBuild based Linux project in Visual Studio.  To enable logging, navigate to Tools > Options > Cross Platform > Logging, or search for “SSH logging” in the search bar at the top of your screen.

Remote connection logging settings under Tools > Options > Cross Platform.

You can configure logging to a file or to the “Cross Platform Logging” pane in the Output Window. Note that for MSBuild based Linux projects, commands issued to the remote machine by MSBuild will not get routed to the Output Window because they are emitted out-of-proc. They are, however, logged to a file with the “msbuild_” prefix.

Send Us Feedback

Your feedback is a critical part of ensuring that we can deliver the best CMake experience.  We would love to know how Visual Studio 2019 version 16.1 Preview 2 is working for you. If you have any questions specific to CMake Tools, please reach out to cmake@microsoft.com or leave a comment. If you find any issues or have a suggestion, the best way to reach out to us is to Report a Problem.

The post Visual Studio CMake Support – Clang/LLVM, CMake 3.14, Vcpkg, and Performance Improvements appeared first on C++ Team Blog.

Clang/LLVM Support in Visual Studio

$
0
0

Visual Studio 2019 version 16.1 Preview 2 comes with support for Clang/LLVM out-of-the-box. Visual Studio has had great tooling for MSVC and GCC for quite a while now. The latest preview brings Clang into the fold.

Visual Studio 2019 includes out of the box support for editing, building, and debugging CMake projects with Clang/LLVM. If you use MSBuild projects, however, don’t worry. Support for MSBuild based .vcxproj projects is coming soon as well. If you are not familiar with Visual Studio’s CMake, support check out how to get started.

If you are developing on Windows and targeting Clang, we hope to make Visual Studio the best IDE for that job. Please try out the preview and let us know what is working well and what isn’t.

Installing Clang/LLVM for use with Visual Studio

The “Desktop development with C++” workload with the Visual Studio installer now includes full support for targeting Clang/LLVM based toolsets. You will also need the actual compiler and tools to build your projects.

Getting Clang on Windows

On Windows, it’s easy to install the Clang tools. Just grab the “Clang compiler for Windows,” an optional component of the “Desktop development with C++” workload. This will install everything you need to develop with Clang on Windows.

Install the “Clang compiler for Windows” optional component as part of the “Desktop development with C++” workload.

You can also install your own copy of Clang/LLVM or even build it from source. If you have already installed Clang/LLVM you don’t need to install the compiler again with the Visual Studio installer. We do recommend that you use the most recent version of Clang to get the best support in the IDE. Older versions may have some limitations. Check out “Using a Custom Version of Clang” below for more information.

Getting Clang on Linux

To use Clang/LLVM on a remote Linux machine with Visual Studio, just install it with your distribution’s package manager. If ‘which clang’ finds the compiler you are good to go.

Getting Started with Clang/LLVM in Visual Studio

Once you have installed Clang, using it with CMake projects is easy. Visual Studio will use the MSVC compiler by default on Windows. On Linux, it will use the distribution’s default compiler, often GCC. To use Clang instead, add a configuration and select one of the Clang presets.

Select “Manage Configurations” from the configuration drop down on the left of the play button. Then click the “Add Configuration” button:

Clang for Windows CMake configuration presets.

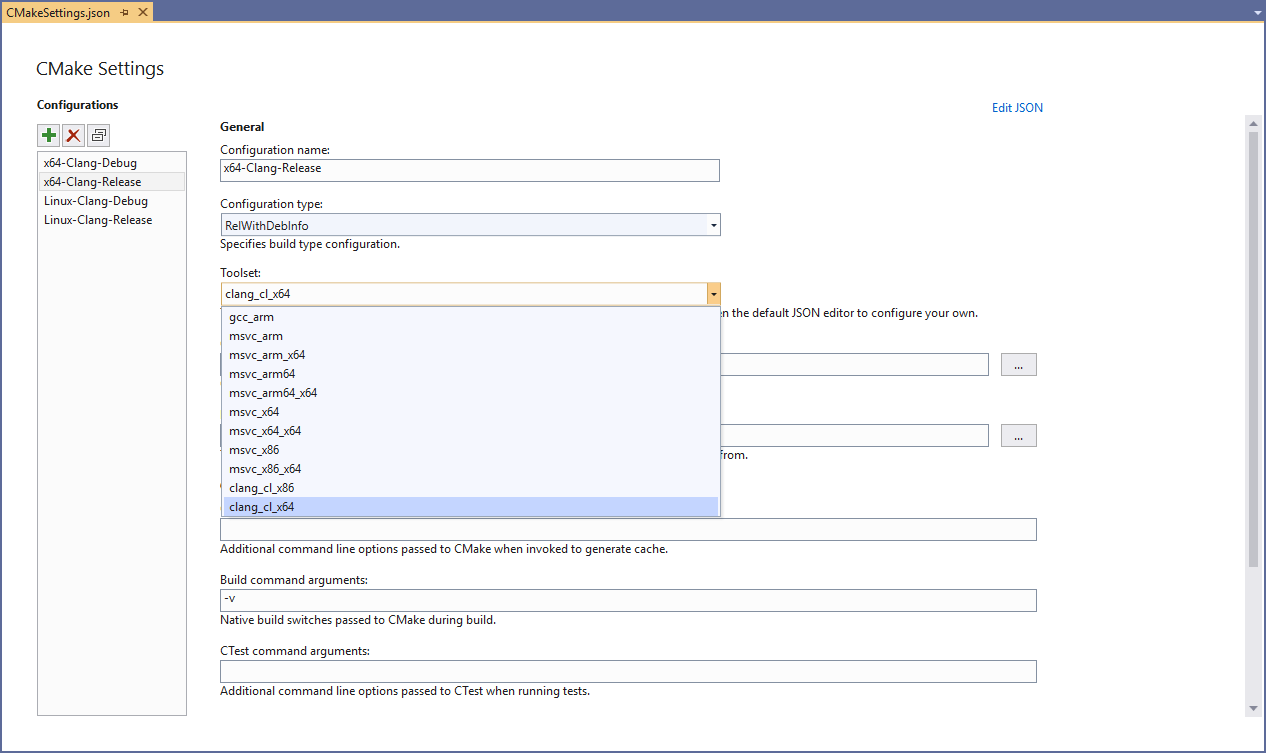
Another option is to modify an existing configuration with the CMake Settings editor to use any of the “clang” toolsets with the Toolset dropdown:

These toolsets will use Clang in clang-cl mode by default on Windows and link with the Microsoft STL. If you are targeting Linux, they will use Clang in GCC compatibility mode. Toolsets to build both 32 and 64-bit binaries are available on Windows while the Linux toolsets will target the architecture of the remote machine. Most of this behavior can be tweaked by customizing either the CMake command line or in the CMake project itself.

Edit, Build, and Debug

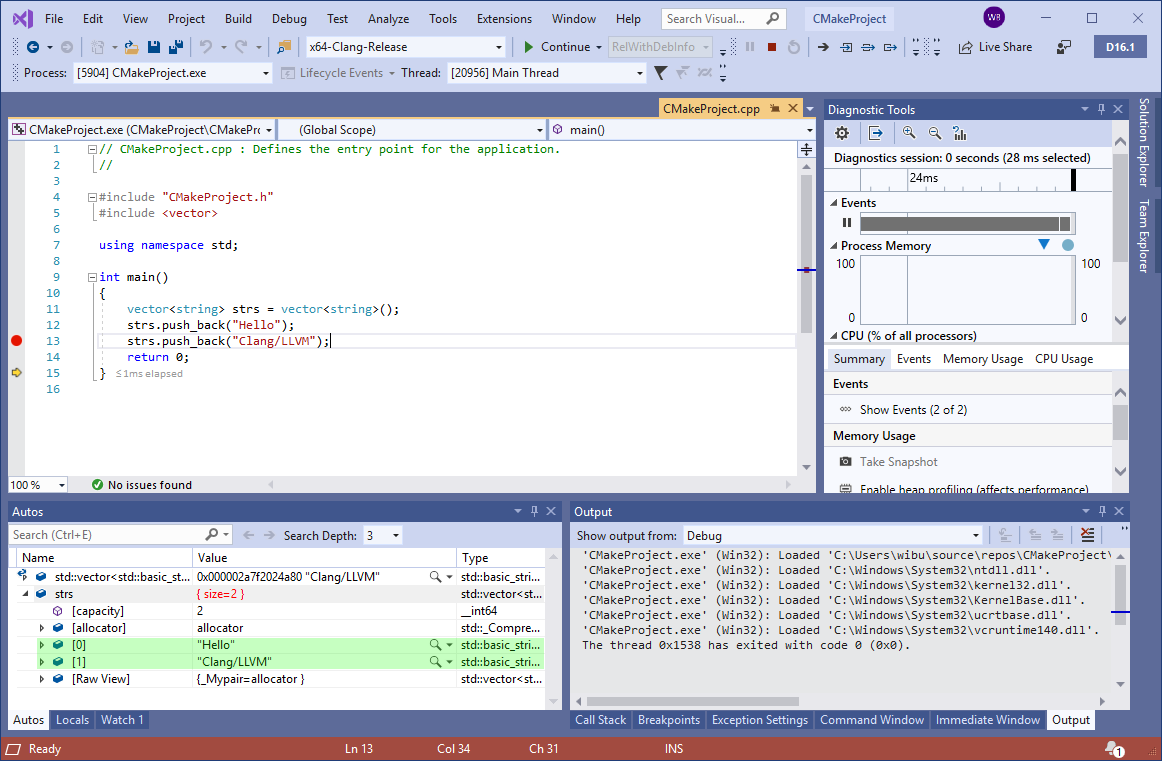
Once you have set up a Clang configuration, build and debug work exactly as you would expect in the IDE. Visual Studio will automatically detect that you are using the Clang compiler and provide applicable IntelliSense, highlighting, navigation, and other editing features. Building projects should just work, provided they are compatible with Clang, with any errors or warnings being directed to the Output Window.

Whether you are targeting Windows or Linux, the debugging experience with Clang should be familiar to you. Most of Visual Studio’s debugging features also work with Clang. There are just a few exceptions for compiler dependent features (e.g. edit and continue.) Breakpoints, memory and data visualization, and other inner development loop debugging features are available:

Using a Custom Installation of Clang

Visual Studio will automatically look for Clang in two places:

  1. (Windows) The internally installed copy of Clang/LLVM that comes with the Visual Studio installer.
  2. (Windows and Linux) The PATH environment variable.

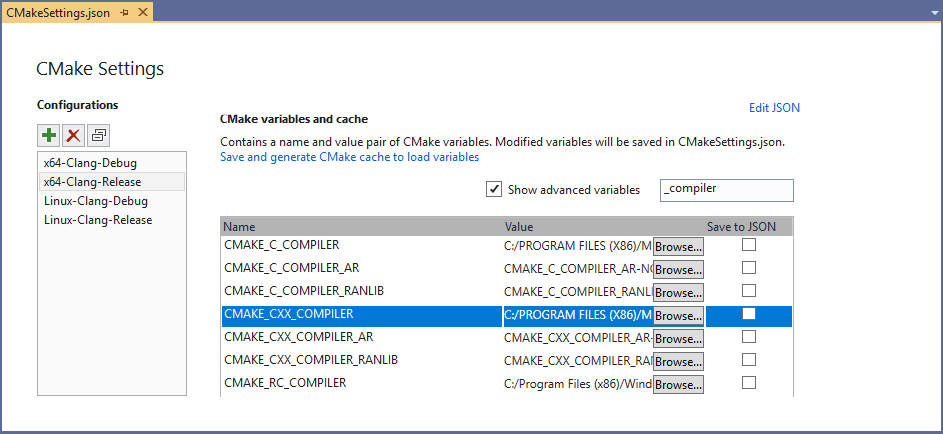
If it doesn’t find Clang in one of those places it will offer to install it on Windows. On Linux, you will need to install it with the distribution’s package manager. Alternatively, you can tell Visual Studio to use another installation of Clang/LLVM on the machine by setting the “CMAKE_C_COMPILER” and “CMAKE_CXX_COMPILER” CMake variables in your CMake Settings:

Set “CMAKE_C/CXX_COMPILER” variables with the CMake Settings editor to use a custom Clang installation.

Keep in mind, however, that using old versions of Clang may come with some limitations. For instance, if you are using the Microsoft STL on Windows, support is only gaurenteed for the most recent version of the compiler. As we release new versions of Visual Studio and the Microsoft STL you may need to upgrade your custom installation.

Using Clang/LLVM with MSBuild Projects

Visual Studio 2019 version 16.1 ships with out of the box support for Clang/LLVM for CMake projects. Support for MSBuild based C++ projects is on the roadmap and will be available soon in a future release. To use Clang/LLVM today with MSBuild based C++ projects there are 3rd party extensions for Visual Studio available.

Send Us Feedback

Please try out the latest preview and let us know if you have any feedback. It is always appreciated! The best way to get in touch with us about an issue or suggestion is though Developer Community with the “Report a Problem” or “Suggest a Feature” tools. This makes it easy for us to follow up and for you to get the latest updates about our progress. Feel free to comment here or send an email to cmake@microsoft.com with questions as well.

The post Clang/LLVM Support in Visual Studio appeared first on C++ Team Blog.

C++ Productivity Improvements in Visual Studio 2019 Preview 2

$
0
0

Visual Studio 2019 Preview 2 contains a host of productivity features, including some new quick fixes and code navigation improvements:

The Quick Actions menu can be used to select the quick fixes referenced below. You can hover over a squiggle and click the lightbulb that appears or open the menu with Alt + Enter.

Quick Fix: Add missing #include

Have you ever forgotten which header to reference from the C++ Standard Library to use a particular function or symbol? Now, Visual Studio will figure that out for you and offer to fix it:
When you use a type or function defined in a different header, and that header was not #included in the file, Visual Studio squiggles the symbol in red. Now, when you hover over the squiggle, you will be shown an option to automatially add the missing #include.

But this feature doesn’t just find standard library headers. It can tell you about missing headers from your codebase too:
The add missing #include quick fix even works for non-STL headers included in your codebase, so you don't have to remember where you declared everything all the time.

Quick Fix: NULL to nullptr

An automatic quick fix for the NULL->nullptr code analysis warning (C26477: USE_NULLPTR_NOT_CONSTANT) is available via the lightbulb menu on relevant lines, enabled by default in the “C++ Core Check Type Rules,” “C++ Core Check Rules,” and “Microsoft All Rules” rulesets.
It is generally bad practice to use the "NULL" macro in modern C++ code, so Visual Studio will place a squiggle under NULLs. When you hover over such a squiggle, Visual Studio will over to replace it with a nullptr for you.
You’ll be able to see a preview of the change for the fix and can choose to confirm it if it looks good. The code will be fixed automatically and green squiggle removed.

Quick Fix: Add missing semicolon

A common pitfall for students learning C++ is remembering to add the semicolon at the end of a statement. Visual Studio will now identify this issue and offer to fix it.
Visual Studio offers to add missing semicolons to your code where needed. Just hover over the squiggle that appears and choose the option to fix it in the menu.

Quick Fix: Resolve missing namespace or scope

Visual Studio will offer to add a “using namespace” statement to your code if one is missing, or alternatively, offer to qualify the symbol’s scope directly with the scope operator:
When you forget to qualify a type or function with the namespace it comes from, Visual Studio will offer to fill in the missing namespace, along with the scope operator, in the code. Alternatively, you can let Visual Studio insert a "using namespace" statement above the code.
Note: we are currently tracking a bug with the quick fix to add “using namespace” that may cause it to not work correctly – we expect to resolve it in a future update.

Quick Fix: Replace bad indirection operands (* to & and & to *)

Did you ever forget to dereference a pointer and manage to reference it directly instead? Or perhaps you meant to refer to the pointer and not what it points to? This quick action offers to fix such issues:
Visual Studio will offer to correct errors arising from using a * insteaof a & in your code (and vice versa). Hover over the squiggle and choose the corresponding fix to resolve the issue.

Quick Info on closing brace

You can now see a Quick Info tooltip when you hover over a closing brace, giving you some information about the starting line of the code block.
When you hover over a closing brace in Visual Studio, context will be provided about the starting line of the code block.

Peek Header / Code File

Visual Studio already had a feature to toggle between a header and a source C++ file, commonly invoked via Ctrl + K, Ctrl + O, or the right-click context menu in the editor. Now, you can also peek at the other file without leaving your current one with Peek Header / Code File (Ctrl + K, Ctrl + J):
You can peek at the header of a C++ source file with Ctrl + K, Ctrl + J. You can also peek at the source file of a header the same way.

Go to Document on #include

F12 is often used to go to the definition of a code symbol. Now you can also do it on #include directives to open the corresponding file. In the right-click context menu, this is referred to as Go to Document:
You can now press F12 on a #include directive to go to that file in Visual Studio.

Other productivity features to check out

We have several more C++ productivity improvements in Preview 2, covered in separate blog posts:

We want your feedback

We’d love for you to download Visual Studio 2019 and give it a try. As always, we welcome your feedback. We can be reached via the comments below or via email (visualcpp@microsoft.com). If you encounter problems with Visual Studio or MSVC, or have a suggestion for us, please let us know through Help > Send Feedback > Report A Problem / Provide a Suggestion in the product, or via Developer Community. You can also find us on Twitter (@VisualC) and Facebook (msftvisualcpp).

In-editor code analysis in Visual Studio 2019 Preview 2

$
0
0

The C++ team has been working to refresh the Code Analysis experience inside Visual Studio. Last year, we blogged about some in-progress features in this area. We’re happy to announce that in Visual Studio 2019 Preview 2, we’ve integrated code analysis directly into the editor, improved upon previously experimental features, and enabled this as the default experience.

In-editor warnings & background analysis

Code analysis now runs automatically in the background, and warnings display as green squiggles in-editor. Analysis re-runs every time you open a file in the editor and when you save your changes.

If you wish to disable – or re-enable – this feature, you can do so via the Tools > Options > Text Editor > C++ > Experimental > Code Analysis menu, where you’ll also be able to toggle squiggles displaying in-editor or the entire new C++ Code Analysis/Error List experience.

Squiggle display improvements

We’ve also made a few improvements to the display style of in-editor warnings. Squiggles are now only displayed underneath the code segment that is relevant to the warning. If we cannot find the appropriate code segment, we fall back to the Visual Studio 2017 behavior of showing the squiggle for the entire line.

Visual Studio 2017

Visual Studio 2019

We’ve also made performance improvements, especially for source files with many C++ code analysis warnings. Latency from when the file is analyzed until green squiggles appear has been greatly improved, and we’ve also enhanced the overall UI performance during code analysis squiggle display.

Light bulb suggestions & quick fixes

We’ve begun adding light bulb suggestions to provide automatic fixes for warnings. Please see the C++ Productivity Improvements in Visual Studio 2019 Preview 2 blog post for more information.

Send us feedback

Thank you to everyone who helps make Visual Studio a better experience for all. Your feedback is critical in ensuring we can deliver the best Code Analysis experience. We’d love for you to download Visual Studio 2019 Preview 2, give it a try, and let us know how it’s working for you in the comments below or via email (visualcpp@microsoft.com). If you encounter problems or have a suggestion, please let us know through Help > Send Feedback > Report A Problem / Provide a Suggestion or via Visual Studio Developer Community. You can also find us on Twitter @VisualC.

Introducing the New CMake Project Settings UI

$
0
0

Visual Studio 2019 Preview 2 introduces a new CMake Project Settings Editor to help you more easily configure your CMake projects in Visual Studio. The editor provides an alternative to modifying the CMakeSettings.json file directly and allows you to create and manage your CMake configurations.  

If you’re just getting started with CMake in Visual Studio, head over to our CMake Support in Visual Studio introductory page

The new CMake Project Settings Editor

The goal of this editor is to simplify the experience of configuring a CMake project by grouping and promoting commonly used settings, hiding advanced settings, and making it easier to edit CMake variables. This is the first preview of this new UI so we will continue to improve it based on your feedback.  

Open the editor

The CMake Project Settings Editor opens by default when you select “Manage Configurations…” from the configuration drop-down menu at the top of the screen.  

Open the CMake Project Settings Editor by selecting "Manage Connections..." from the configuration drop-down menu at the top of the screen.

You can also right-click on CMakeSettings.json in the Solution Explorer and select “Edit CMake Settings” from the context menu. If you prefer to manage your configurations directly from the CMakeSettings.json file, you can click the link to “Edit JSON” in the top right-hand corner of the editor.  

Configurations sidebar

The left side of the editor contains a configurations sidebar where you can easily toggle between your existing configurations, add a new configuration, and remove configurations. You can also now clone an existing configuration so that the new configuration inherits all properties set by the original. 

The configurations sidebar is on the left side of the editor.

Sections of the editor

The editor contains four sections: General, Command Arguments, CMake Variables and Cache, and Advanced. The General, Command Arguments, and Advanced sections provide a user interface for properties exposed in the CMakeSettings.json file. The Advanced section is hidden by default and can be expanded by clicking the link to “Show advanced settings” at the bottom of the editor.  

The CMake Variables and Cache section provides a new way for you to edit CMake variables. You can click “Save and Generate CMake Cache to Load Variables” to generate the CMake cache and populate a table with all the CMake cache variables available for you to edit. Advanced variables (per the CMake GUI) are hidden by default. You can check “Show Advanced Variables” to show all cache variables or use the search functionality to filter CMake variables by name. 

The CMake Variables and Cache section provides a new way for you to edit CMake variables.

You can change the value of any CMake variable by editing the “Value” column of the table. Modified variables are automatically saved to CMakeSettings.json 

Linux configurations

The CMake Project Settings Editor also provides support for Linux configurations. If you are targeting a remote Linux machine, the editor will expose properties specific to a remote build and link to the Connection Manager, where you can add and remove connections to remote machines.  

CMake Settings support for Linux configurations.

Give us your feedback!

We’d love for you to download Visual Studio 2019 and give it a try. As always, we welcome your feedback. We can be reached via the comments below or via email (visualcpp@microsoft.com). If you encounter other problems with Visual Studio or MSVC or have a suggestion please let us know through Help > Send Feedback > Report A Problem / Provide a Suggestion in the product, or via Developer Community. You can also find us on Twitter (@VisualC) and Facebook (msftvisualcpp). 

Concurrency Code Analysis in Visual Studio 2019

$
0
0

Concurrency Code Analysis in Visual Studio 2019

The battle against concurrency bugs poses a serious challenge to C++ developers. The problem is exacerbated by the advent of multi-core and many-core architectures. To cope with the increasing complexity of multithreaded software, it is essential to employ better tools and processes to help developers adhere to proper locking discipline. In this blog post, we’ll walk through a completely rejuvenated Concurrency Code Analysis toolset we are shipping with Visual Studio 2019 Preview 2.

A perilous landscape

The most popular concurrent programming paradigm in use today is based on threads and locks. Many developers in the industry have invested heavily in multithreaded software. Unfortunately, developing and maintaining multithreaded software is difficult due to a lack of mature multi-threaded software development kits.

Developers routinely face a dilemma in how to use synchronization. Too much may result in deadlocks and sluggish performance. Too little may lead to race conditions and data inconsistency. Worse yet, the Win32 threading model introduces additional pitfalls. Unlike in managed code, lock acquire and lock release operations are not required to be syntactically scoped in C/C++. Applications therefore are vulnerable to mismatched locking errors. Some Win32 APIs have subtle synchronization side effects. For example, the popular “SendMessage” call may induce hangs among UI threads if not used carefully. Because concurrency errors are intermittent, they are among the hardest to catch during testing. When encountered, they are difficult to reproduce and diagnose. Therefore, it is highly beneficial to apply effective multi-threading programming guidelines and tools as early as possible in the engineering process.

Importance of locking disciplines

Because one generally cannot control all corner cases induced by thread interleaving, it is essential to adhere to certain locking disciplines when writing multithreaded programs. For example, following a lock order while acquiring multiple locks or using std::lock() consistently helps to avoid deadlocks; acquiring the proper guarding lock before accessing a shared resource helps to prevent race conditions. However, these seemingly simple locking rules are surprisingly hard to follow in practice.

A fundamental limitation in today’s programming languages is that they do not directly support specifications for concurrency requirements. Programmers can only rely on informal documentation to express their intention regarding lock usage. Thus, developers have a clear need for pragmatic tools that help them confidently apply locking rules.

Concurrency Toolset

To address the deficiency of C/C++ in concurrency support, we had shipped an initial version of concurrency analyzer back in Visual Studio 2012, with promising initial results. This tool had a basic understanding of the most common Win32 locking APIs and concurrency related annotations.

In Visual Studio 2019 Preview 2, we are excited to announce a completely rejuvenated set of concurrency checks to meet the needs of modern C++ programmers. The toolset comprises a local intra-procedural lock analyzer with built-in understanding of common Win32 locking primitives and APIs, RAII locking patterns, and STL locks.

Getting started

The concurrency checks are integrated as part of the code analysis toolset in Visual Studio. The default “Microsoft Native Recommended Ruleset” for the project comprises the following rules from the concurrency analyzer. This means, whenever you run code analysis in your project, these checks are automatically executed. These checks are also automatically executed as part of the background code analysis runs for your project. For each rule, you can click on the link to learn more about the rule and its enforcement with clear examples.

  • C26100: Race condition. Variable should be protected by a lock.
  • C26101: Failing to use interlocked operation properly for a variable.
  • C26110: Caller failing to acquire a lock before calling a function which expects the lock to be acquired prior to being called.
  • C26111: Caller failing to release a lock before calling a function which expects the lock to be released prior to being called.
  • C26112: Caller cannot hold any lock before calling a function which expects no locks be held prior to being called.
  • C26115: Failing to release a lock in a function. This introduces an orphaned lock.
  • C26116: Failing to acquire a lock in a function, which is expected to acquire the lock.
  • C26117: Releasing an unheld lock in a function.
  • C26140: Undefined lock kind specified on the lock.

If you want to try out the full set of rules from this checker, there’s a ruleset just for that. You must right click on Project > Properties > Code Analysis > General > Rulesets > Select “Concurrency Check Rules”.

Screenshot of the Code Analysis properties page that shows the ConcurrencyCheck Rules ruleset selected.

You can learn more about each rule enforced by the checker by searching for rule numbers in the ranges C26100 – C26199 in our Code Analysis for C/C++ warning document.

Concurrency toolset in action

The initial version of concurrency toolset was capable of finding concurrency related issues like race conditions, locking side effects, and potential deadlocks in mostly C-like code.

The tool had in-built understanding of standard Win32 locking APIs. For custom functions with locking side effects, the tool understood a number of concurrency related annotations. These annotations allowed the programmer to express locking behavior. Here are some examples of concurrency related annotations.

  • _Acquires_lock_(lock): Function acquires the lock object “lock”.
  • _Releases_lock_(lock): Function releases the lock object “lock”.
  • _Requires_lock_held_(lock): Lock object “lock” must be acquired before entering this function.
  • _Guarded_by_(lock) data: “data” must always be protected by lock object “lock”.
  • _Post_same_lock(lock1, lock2): “lock1” and “lock2” are aliases.

For a complete set of concurrency related annotations, please see this article Annotating Locking Behavior.

The rejuvenated version of the toolset builds on the strengths of the initial version by extending its analysis capabilities to modern C++ code. For example, it now understands STL locks and RAII patterns without having to add any annotations.

Now that we have talked about how the checker works and how you can enable them in your project, let’s look at some real-world examples.

Example 1

Can you spot an issue with this code1 ?

struct RequestProcessor {​
    CRITICAL_SECTION cs_;​
    std::map<int, Request*> cache_;​
​
    bool HandleRequest(int Id, Request* request) {​
        EnterCriticalSection(&cs_);​
        if (cache_.find(Id) != cache_.end()) ​
            return false;    ​
        cache_[Id] = request;                    ​
        LeaveCriticalSection(&cs_);   ​
    }​
    void DumpRequestStatistics() {​
        for (auto& r : cache_) ​
            std::cout << "name: " << r.second->name << std::endl;​
    }​
};​

1 If you have seen this talk given by Anna Gringauze in CppCon 2018, this code may seem familiar to you.

Let’s summarize what’s going on here:

  1. In function HandleRequest, we acquire lock cs on line 6. However, we return early from line 8 without ever releasing the lock.
  2. In function HandleRequest, we see that cache_ access must be protected by lock cs. However, in a different function, DumpStatistics, we access cache_ without acquiring any lock.

If you run code analysis on this example, you’ll get a warning in method HandleRequest, where it will complain about the leaked critical section (issue #1):

This shows the leaked critical section warning from the concurrency analyzer.

Next, if you add the _Guarded_by_ annotation on the field cache_ and select ruleset “Concurrency Check Rules”, you’ll get an additional warning in method DumpRequestStatistics for the possible race condition (issue #2):

This shows the potential race condition warning from the concurrency analyzer.

Example 2

Let’s look at a more modern example. Can you spot an issue with this code1 ?

struct RequestProcessor2 {​
    std::mutex​ m_;
    std::map<int, Request*> cache_;​
​
    void HandleRequest(int Id, Request* request) {​
        std::lock_guard grab(m_);
        if (cache_.find(Id) != cache_.end()) ​
            return;    ​
        cache_[Id] = request;                    ​
    }​
    void DumpRequestStatistics() {​
        for (auto& r : cache_) ​
            std::cout << "name: " << r.second->name << std::endl;​
    }​
};

As expected, we don’t get any warning in HandleRequest in the above implementation using std::lock_guard. However, we still get a warning in DumpRequestStatistics function:

This shows the potential race condition warning from the concurrency analyzer.

There are a couple of interesting things going on behind the scenes here. First, the checker understands the locking nature of std::mutex. Second, it understands that std::lock_guard holds the mutex and releases it during destruction when its scope ends.

This example demonstrates some of the capabilities of the rejuvenated concurrency checker and its understanding of STL locks and RAII patterns.

Give us feedback

We’d love to hear from you about your experience of using the new concurrency checks. Remember to switch to “Concurrency Check Rules” for your project to explore the full capabilities of the toolset. If there are specific concurrency patterns you’d like us to detect at compile time, please let us know.

If you have suggestions or problems with this check — or any Visual Studio feature — either Report a Problem or post on Developer Community. We’re also on Twitter at @VisualC.

New Code Analysis Checks in Visual Studio 2019: use-after-move and coroutine

$
0
0

New Code Analysis Checks in Visual Studio 2019: use-after-move and coroutine

Visual Studio 2019 Preview 2 is an exciting release for the C++ code analysis team. In this release, we shipped a new set of experimental rules that help you catch bugs in your codebase, namely: use-after-move and coroutine checks. This article provides an overview of the new rules and how you can enable them in your project.

Use-after-move check

C++11 introduced move semantics to help write performant code by replacing some expensive copy operations with cheaper move operations. With the new capabilities of the language, however, we have new ways to make mistakes. It’s important to have the tools to help find and fix these errors.

To understand what these errors are, let’s look at the following code example:

MyType m;
consume(std::move(m));
m.method();

Calling consume will move the internal representation of m. According to the standard, the move constructor must leave m in a valid state so it can be safely destroyed. However, we can’t rely on what that state is. We shouldn’t call any methods on m that have preconditions, but we can safely reassign m, since the assignment operator does not have a precondition on the left-hand side. Therefore, the code above is likely to contain latent bugs. The use after move check is intended to find exactly such code, when we are using a moved-from object in a possibly unintended way.

There are several interesting things happening in the above example:

  • std::move does not actually move m. It’s only cast to a rvalue reference. The actual move happens inside the function consume.
  • The analysis is not inter-procedural, so we will flag the code above even if consume is not actually moving m. This is intentional, since we shouldn’t be using rvalue references when moving is not involved – it’s plain confusing. We recommend rewriting such code in a cleaner way.
  • The check is path sensitive, so it will follow the flow of execution and avoid warning on code like the one below.
    Y y;
    if (condition)
      consume(std::move(y));
    if (!condition)
      y.method();

In our analysis, we basically track what’s happening with the objects.

  • If we reassign a moved-from object it is no longer moved from.
  • Calling a clear function on a container will also cleanse the “moved-from”ness from the container.
  • We even understand what “swap” does, and the code example below works as intended:
    Y y1, y2;
    consume(std::move(y1));
    std::swap(y1, y2);
    y1.method();   // No warning, this is a valid object due to the swap above.
    y2.method();   // Warning, y2 is moved-from.

Coroutine related checks

Coroutines are not standardized yet but they are well on track to become standard. They are the generalizations of procedures and provide us with a useful tool to deal with some concurrency related problems.

In C++, we need to think about the lifetimes of our objects. While this can be a challenging problem on its own, in concurrent programs, it becomes even harder.

The code example below is error prone. Can you spot the problem?

std::future async_coro(int &counter)
{
  Data d = co_await get_data();
  ++counter;
}

This code is safe on its own, but it’s extremely easy to misuse. Let’s look at a potential caller of this function:

int c;
async_coro(c);

The source of the problem is that async_coro is suspended when get_data is called. While it is suspended, the flow of control will return to the caller and the lifetime of the variable c will end. By the time async_coro is resumed the argument reference will point to dangling memory.

To solve this problem, we should either take the argument by value or allocate the integer on the heap and use a shared pointer so its lifetime will not end too early.

A slightly modified version of the code is safe, and we will not warn:

std::future async_coro(int &counter)
{
  ++counter;
  Data d = co_await get_data();
}

Here, we’ll only use the counter before suspending the coroutine. Therefore, there are no lifetime issues in this code. While we don’t warn for the above snippet, we recommend against writing clever code utilizing this behavior since it’s more prone to errors as the code evolves. One might introduce a new use of the argument after the coroutine was suspended.

Let’s look at a more involved example:

int x = 5;
auto bad = [x]() -> std::future {
  co_await coroutine();
  printf("%d\n", x);
};
bad();

In the code above, we capture a variable by value. However, the closure object which contains the captured variable is allocated on the stack. When we call the lambda bad, it will eventually be suspended. At that time, the control flow will return to the caller and the lifetime of captured x will end. By the time the body of the lambda is resumed, the closure object is already gone. Usually, it’s error prone to use captures and coroutines together. We will warn for such usages.

Since coroutines are not part of the standard yet, the semantics of these examples might change in the future. However, the currently implemented version in both Clang and MSVC follows the model described above.

Finally, consider the following code:

generator mutex_acquiring_generator(std::mutex& m) {
  std::lock_guard grab(m);
  co_yield 1;
}

In this snippet, we yield a value while holding a lock. Yielding a value will suspend the coroutine. We can’t be sure how long the coroutine will remain suspended. There’s a chance we will hold the lock for a very long time. To have good performance and avoid deadlocks, we want to keep our critical sections short. We will warn for the code above to help with potential concurrency related problems.

Enabling the new checks in the IDE

Now that we have talked about the new checks, it’s time to see them in action. The section below describes the step-by-step instructions for how to enable the new checks in your project for Preview 2 builds.

To enable these checks, we go through two basic steps. First, we select the appropriate ruleset and second, we run code analysis on our file/project.

Use after free

  1. Select: Project > Properties > Code Analysis > General > C++ Core Check Experimental Rules.
    Screenshot of the Code Analysis properties page that shows the C++ Core Check Experimental Rules ruleset selected.
  2. Run code analysis on the source code by right clicking on File > Analyze > Run code analysis on file.
  3. Observe warning C26800 in the code snippet below:
    Screenshot showing "use of a moved from object" warning

Coroutine related checks

  1. Select: Project > Properties > Code Analysis > General > Concurrency Rules.Screenshot of the Code Analysis properties page that shows the Concurrency Rules ruleset selected.
  2. Run code analysis on the source code by right clicking on File > Analyze > Run code analysis on file.
  3. Observe warning C26810 in the code snippet below:Screenshot showing a warning that the lifetime of a captured variable might end before a coroutine is resumed.
  4. Observe warning C26811 in the code snippet below:Screenshot showing a warning that the lifetime of a variable might end before the coroutine is resumed.
  5. Observe warning C26138 in the code snippet below:Screenshot shows a warning that we are suspending a coroutine while holding a lock.

Wrap Up

We’d love to hear from you about your experience of using these new checks in your codebase, and also for you to tell us what sorts of checks you’d like to see from us in the future releases of VS. If you have suggestions or problems with these checks — or any Visual Studio feature — either Report a Problem or post on Developer Community and let us know. We’re also on Twitter at @VisualC.


Visual Studio Code C/C++ extension: January 2019 Update

$
0
0

The January 2019 update of the Visual Studio Code C++ extension is now available. This release includes many new features and bug fixes including documentation comments support, improved #include autocomplete performance, better member function completion, and many IntelliSense bug fixes. For a full list of this release’s improvements, check out our release notes on Github.

Documentation Comments

We added support for documentation comments for hover, completion, and signature help. You can now see documentation comments in tooltips. Let’s look at a simple box_sample.cpp program that defines a “Box” object with various dimensions.

Class box with lenght, width, height. Function volume that takes in lenght, width, height and returns length * width * height. Main that creates a new Box package and sets length to 2.0, width to 2.0, and height to 4.0. Prints package.volume.

The comment associated with a class or member function is shown in a tooltip when you hover over a place where the class or member function is used. For example, we can see the “Box object” comment in our main function where we create a Box instance:

Hovering over Box provides a tooltip with the comment for the Box member function

#include Autocomplete

This update improves #include autocomplete performance. It now shows individual folders instead of entire paths, thus fixing previous performance issues. When you autocomplete the #include recommendation. In the example below, we modified our original box_sample.cpp program where we place the Box object definition in a separate header file within the “Objects” folder. Now, when we go into our main box_sample.cpp file and see our #include auto-complete suggestion, we see the “Objects” folder auto-complete recommendation.

#include provides an autocomplete suggestion for the Objects folder which contains the box.h header file

Improved Member Function Completion

With improved member function completion, the selected completion is committed after a parenthesis “(“ is entered. This removes the need to accept an autocompletion (using tab, enter, or click) and type the parenthesis. You will now receive the suggested text along with parentheses and the cursor in the middle for a simpler editing experience. Here’s a look at how this works with the “volume” member function for our Box object:

The volume member function in main is completed when you type just "vo" and a "("

This also works for class and member function templates after you type a “<” completion character.

Note that if you accept the autocompletion using tab, enter, or click, we do not currently auto-add the parenthesis.

IntelliSense Bug Fixes

As per customer feedback, we’re continuing to work on bug fixes for IntelliSense. This release we’ve made some IntelliSense fixes including error squiggle improvements, process crash fixes, and increased stability.

You can see additional details of the issues we fixed in our release notes on GitHub.

Tell Us What You Think

Download the C/C++ extension for Visual Studio Code, give it a try, and let us know what you think. If you run into any issues, or have any suggestions, please report them on the Issues section of our GitHub repository. Join our Insiders program to get early builds of our extension.

Please also take our quick survey to help us shape this extension to meet your needs. We can be reached via the comments below or via email (visualcpp@microsoft.com). You can also find us on Twitter (@VisualC).

C++ Binary Compatibility and Pain-Free Upgrades to Visual Studio 2019

$
0
0

Visual Studio 2019 pushes the boundaries of individual and team productivity. We hope that you will find these new capabilities compelling and start your upgrade to Visual Studio 2019 soon.

As you are considering this upgrade, rest assured that Visual Studio 2019 makes it distinctively easy to move your codebase from previous versions of Visual Studio. This post captures the reasons why your upgrade to Visual Studio 2019 will be pain-free.

Side-by-side Visual Studio Installations

You can install the latest version of Visual Studio on a computer that already has an earlier version installed and continue to use both versions in parallel with no interference. This is a great way to try Visual Studio 2019 or adopt it for some of your projects. The Visual Studio Installer will let you manage installations of Visual Studio 2017 and 2019 from a central UI.

Visual Studio Installer image showing VS 2017 and VS 2019 installed side-by-side

MSVC v140 (VS 2015.3) and MSVC v141 (VS 2017) Toolsets in the Visual Studio 2019 IDE

Even if you are not ready yet to move your project to the latest toolset (MSVC v142), you can still load your project in the Visual Studio 2019 IDE and continue to use your current older toolset.

Loading your existing C++ projects into the IDE will not upgrade/change your project files. This way, your projects also load in the previous version of the IDE in case you need to go back or you have teammates that have not yet upgraded to VS 2019 (this functionality is also known as project round-tripping).

Toolsets from older VS installations on your box are visible as platform toolsets in the latest IDE. And if you are starting fresh with only VS 2019 installed on your machine, it is very easy to acquire these older toolsets directly from the Visual Studio Installer by customizing the C++ Desktop workload (with the Individual Components tab listing all the options).

VS Installer Individual Components tab showing the full list of C++ components available in VS 2019

New v142 toolset now available

Within the Visual Studio 2019 wave (previews, its general availability, and future updates), we plan to continue evolving our C++ compilers and libraries with

  • new C++20 features,
  • faster build throughput, and
  • even better codegen optimizations.

The MSVC v142 toolset is now available and it already brings several incentives for you to migrate.

VC Runtime in the latest MSVC v142 toolset is binary compatible with v140 and v141

We heard it loud and clear that a major reason contributing to MSVC v141’s fast adoption today is its binary compatibility with MSVC v140. This allowed you to migrate your own code to the v141 toolset at your own pace, without having to wait for any of your 3rd party library dependencies to migrate first.

We want to keep the momentum going and make sure that you have a similarly successful adoption experience with MSVC v142 too. This is why we’re announcing today that our team is committed to provide binary compatibility for MSVC v142 with both MSVC v141 and v140.

This means that if you compile all your code with the v142 toolset but still have one or more libraries that are built with the v140 or v141 toolset, linking all of it together (with the latest linker) will work as expected. To make this possible, VC Runtime does not change its major version in VS 2019 and remains backward compatible with previous VC Runtime versions.

C:\source\repos\TimerApp\Debug>dumpbin TimerApp2019.exe /IMPORTS | findstr .dll
mfc140ud.dll
KERNEL32.dll
USER32.dll
GDI32.dll
COMCTL32.dll
OLEAUT32.dll
gdiplus.dll
VCRUNTIME140D.dll
ucrtbased.dll
       2EE _seh_filter_dll

When you mix binaries built with different supported versions of the MSVC toolset, there is a version requirement for the VCRedist that you redistribute with your app. Specifically, the VCRedist can’t be older than any of the toolset versions used to build your app.

Hundreds of C++ libraries on Vcpkg are available regardless of the toolset you’re using

If you are using Vcpkg today with VS 2015 or VS 2017 for one or more of your open-source dependencies, you will be happy to learn that these libraries (close to 900 at the time of this writing) can now be compiled with the MSVC v142 toolset and are available for consumption in Visual Studio 2019 projects.

If you are just getting started with Vcpkg, no worries – Vcpkg is an open-source project from Microsoft to help simplify the acquisition and building of open-source C++ libraries on Windows, Linux, and Mac.

Because v142 is binary compatible with v141 and v140, all the packages you’ve already installed will also continue to work in VS 2019 without recompilation; however, we do recommend recompiling when you can so that you can enjoy the new compiler optimizations we’ve added to v142!

If you have VS 2019 Preview installed side-by-side with an older version of VS (e.g. VS 2017), Vcpkg will prefer the stable release, so you will need to set Vcpkg’s triplet variable VCPKG_PLATFORM_TOOLSET to v142 to use the latest MSVC toolset.

MSVC compiler version changes to 19.2x (from 19.1x in MSVC v141)

Last but not least, the compiler part of the MSVC v142 toolset changes its version to 19.20 – only a minor version increment compared with MSVC v141.

VS editor with Quick Info showing that _MSC_VER macro equals 1920
Note that feature-test macros are supported in the MSVC compiler and STL starting with MSVC v141 and they should be the preferred option to enable your code to support multiple MSVC versions.

Call to action

Please download Visual Studio 2019 today and let us know what you think. Our goal is to make your transition to VS 2019 as easy as possible so, as always, we are very interested in your feedback. We can be reached via the comments below or via email (visualcpp@microsoft.com).
If you encounter other problems with Visual Studio or MSVC or have a suggestion please let us know through Help > Send Feedback > Report A Problem / Provide a Suggestion in the product, or via Developer Community. You can also find us on Twitter at @VisualC.

What’s New in CMake – Visual Studio 2019 Preview 2

$
0
0

We have made a bunch of improvements to Visual Studio’s CMake support in the latest preview of the IDE. Many of these changes are taking the first steps to close the gap between working with solutions generated by CMake and the IDE’s native support. Please try out the preview and let us know what you think.

If you are new to CMake in Visual Studio, check out how to get started.

CMake Menu Reorganization

One of the first things you might notice when you open your CMake projects in Visual Studio 2019 Preview 2 is that the CMake menu has disappeared. Don’t worry, nothing is wrong. We just reorganized these items into the existing Project, Build, Debug, and Test menus. For instance, the Project menu now looks like this:

New Project menu with CMake Settings and cache control.

The CMake settings and cache control entries have been moved from the CMake menu to the project menu. Items related to Build, Debug, and Test have been moved accordingly. We hope this reorganization is more intuitive to new users and users who have been using Visual Studio for a long time.

CMake Settings Editor

We received a lot of feedback about the CMakeSettings.json since we first shipped CMake support in Visual Studio. To simplify configuring CMake projects, we have added a graphical editor for CMake Settings.

CMake Settings editor.

You can learn more about the editor here. We would love to hear your feedback about what works well and what doesn’t for your projects. Please try it out and let us know.

Vcpkg Integration

If you have installed vcpkg, CMake projects opened in Visual Studio will automatically integrate the vcpkg toolchain file. This means you don’t have to do any additional configuration to use vcpkg with your CMake projects. This support works for both local vcpkg installations and vcpkg installations on remote machines that you are targeting. This behavior is disabled automatically when you specify any other toolchain in your CMake Settings configuration.

If you are interested in learning more about vcpkg and CMake, stay tuned. A more detailed post about using vcpkg with CMake is coming to the blog soon.

Easier CMake Toolchain Customization

If you use custom CMake toolchain files, configuring your projects just got a little bit easier. Previously, you had to manually specify CMake toolchain files with the “cmakeArgs” parameter in CMakeSettings.json. Now, instead of adding “-DCMAKE_TOOLCHAIN_FILE=…” to the command line you can simply add a “cmakeToolchain” parameter to your configuration in CMake Settings.

The IDE will warn you if you attempt to specify more than one toolchain file.

Automatic Installation of CMake on Linux Targets

Visual Studio’s Linux support for CMake projects requires a recent version of CMake to be installed on the target machine. Often, the version offered by a distribution’s default package manager is not recent enough to support all the IDE’s features. Previously, the only way to work around this was to build CMake from source or install more recent pre-built binaries manually. This was especially painful for users who targeted many Linux machines.

The latest preview of Visual Studio can automatically install a user local copy of CMake on remote Linux machines that don’t have a recent (or any) version of CMake installed. If a compatible version of CMake isn’t detected the first time you build your project, you will see an info-bar asking if you want to install CMake. With one click you will be ready to build and debug on the remote machine.

Support for Just My Code

Visual Studio 2019 Preview 2 also adds Just My Code support for CMake projects. If you are building for Windows using the MSVC compiler your CMake projects will now enable Just my Code support in the compiler and linker automatically.

To debug with Just my Code, make sure the feature is enabled in Tools > Options > Debugging > General.

Tools > Options > Debugger > General, "Enable Just My Code."

For now, you will need to use the version of CMake that ships with Visual Studio to get this functionality. This feature will be available for all installations of CMake in an upcoming version. If you need to suppress this behavior for any reason you can modify your CMakeLists to remove the “/JMC” flag from “CMAKE_CXX_FLAGS”.

Warnings for Misconfigured CMake Settings

A common source of user feedback and confusion has been the results of choosing incompatible settings for a CMake project’s configuration in CMakeSettings.json. For instance:

  • Using a 32-bit generator with a 64-bit configuration.
  • Using the wrong kind of verbosity syntax in “buildCommandArgs” for the chosen generator.

Warnings for misconfigured CMake Settings.

These misconfigurations are now called out explicitly by the IDE instead of causing CMake configuration failures that can often be difficult to diagnose.

Better Build Feedback and CMake Configure Verbosity

CMake project build and configuration progress is now better integrated into the IDE’s UI. You will see build progress in the status bar when using the Ninja and MSBuild generators.

You also now have more control over the verbosity of messages from CMake during configure. By default, most messages will be suppressed unless there is an error. You can see all messages by enabling this feature in Tools > Options > CMake.

Tools > Options > CMake > General, "Enable verbose CMake diagnostic output."

Send Us Feedback

Your feedback is a critical part of ensuring that we can deliver the best CMake experience.  We would love to know how Visual Studio 2019 Preview is working for you. If you have any feedback specific to CMake Tools, please reach out to cmake@microsoft.com. For general issues please Report a Problem.

Using VS Code for C++ development with containers

$
0
0

This post builds on using multi-stage containers for C++ development. That post showed how to use a single Dockerfile to describe a build stage and a deployment stage resulting in a container optimized for deployment. It did not show you how to use a containers with your development environment. Here we will show how to use those containers with VS Code. The source for this article is the same as that of the previous article: the findfaces GitHub repo.

Creating a container for use with VS Code

VS Code has the capability to target a remote system for debugging. Couple that with a custom build task for compiling in your container and you will have an interactive containerized C++ development environment.

We’ll need to change our container definition a bit to enable using it with VS Code. These instructions are based on some base container definitions that David Ducatel has provided in this GitHub repo. What we’re doing here is taking those techniques and applying them to our own container definition. Let’s look at another Dockerfile for use with VS Code, Dockerfile.vs.

FROM findfaces/build

LABEL description="Container for use with VS"

RUN apk update && apk add --no-cache \
    gdb openssh rsync zip

RUN echo 'PermitRootLogin yes' >> /etc/ssh/sshd_config && \
    echo 'PermitEmptyPasswords yes' >> /etc/ssh/sshd_config && \
    echo 'PasswordAuthentication yes' >> /etc/ssh/sshd_config && \
    ssh-keygen -A

EXPOSE 22 
CMD ["/usr/sbin/sshd", "-D"]

In the FROM statement we’re basing this definition on the local image we created earlier in our multi-stage build. That container already has all our basic development prerequisites, but for VS Code usage we need a few more things enumerated above. Notably, we need SSH for communication with VS Code for debugging which is configured in the RUN command. As we are enabling root login, this container definition is not appropriate for anything other than local development. The entry point for this container is SSH specified in the CMD line. Building this container is simple.

docker build -t findfaces/vs -f Dockerfile.vs .

We need to specify a bit more to run a container based on this image so VS Code can debug processes in it.

docker run -d -p 12345:22 --security-opt seccomp:unconfined -v c:/source/repos/findfaces/src:/source --name findfacesvscode findfaces/vs

One of the new parameters we haven’t covered before is –security-opt. As debugging requires running privileged operations, we’re running the container in unconfined mode. The other new parameter we’re using is -v, which creates a bind mount that maps our local file system into the container. This is so that when we edit files on our host those changes are available in the container without having to rebuild the image or copy them into the running container. If you look at Docker’s documentation, you’ll find that volumes are usually preferred over bind mounts today. However, sharing source code with a container is considered a good use of a bind mount. Note that our build container copied our src directory to /src. Therefore in this container definition we will use interactively we are mapping our local src directory to /source so it doesn’t conflict with what is already present in the build container.

Building C++ in a container with VS Code

First, let’s configure our build task. This task has already been created in tasks.json under the .vscode folder in the repo we’re using with this post. To configure it in a new project, press Ctrl+Shift+B and follow the prompts until you get to “other”. Our configured build task appears as follows.

{
    "version": "2.0.0",
    "tasks": [
        {
            "label": "build",
            "type": "shell",
            "command": "ssh",
            "args": [
                "root@localhost",
                "-p",
                "34568",
                "/source/build.sh"
            ],
            "problemMatcher": [
                "$gcc"
            ]
        }
    ]
}

The “label” value tells VS Code this is our build task and the type that we’re running a command in the shell. The command here is ssh (which is available on Windows 10). The arguments are passing the parameters to ssh to login to the container with the correct port and run a script. The content of that script reads as follows.

cd /source/output && \
cmake .. -DCMAKE_BUILD_TYPE=Debug -DCMAKE_TOOLCHAIN_FILE=/tmp/vcpkg/scripts/buildsystems/vcpkg.cmake -DVCPKG_TARGET_TRIPLET=x64-linux-musl && \
make

You can see that this script just invokes CMake in our output directory, then builds our project. The trick is that we are invoking this via ssh in our container. After this is set up, you can run a build at any time from within VS Code, as long as your container is running.

Debugging C++ in a container with VS Code

To bring up the Debug view click the Debug icon in the Activity Bar. Tasks.json has already been created in the .vscode folder of the repo for this post. To create one in a new project, select the configure icon and follow the prompts to choose any configuration. The configuration we need is not one of the default options, so once you have your tasks.json select Add Configuration and choose C/C++: (gdb) Pipe Launch. The Pipe Launch configuration starts a tunnel, usually SSH, to connect to a remote machine and pipe debug commands through.

You’ll want to modify the following options in the generated Pipe Launch configuration.

            "program": "/source/output/findfaces",
            "args": [],
            "stopAtEntry": true,
            "cwd": "/source/out",

The above parameters in the configuration specify the program to launch on the remote system, any arguments, whether to stop at entry, and what the current working directory on the remote is. The next block shows how to start the pipe.

            "pipeTransport": {
                "debuggerPath": "/usr/bin/gdb",
                "pipeProgram": "C:/Windows/system32/OpenSSH/ssh.exe",
                "pipeArgs": [
                    "root@localhost",
                    "-p",
                    "34568"
                ],
                "pipeCwd": ""
            },

You’ll note here that “pipeProgram” is not just “ssh”, the full path to the executable is required. The path in the example above is the full path to ssh on Windows, it will be different on other systems. The pipe arguments are just the parameters to pass to ssh to start the remote connection. The debugger path option is the default and is correct for this example.
We need to add one new parameter at the end of the configuration.

            "sourceFileMap": {
                "/source": "c:/source/repos/findfaces/src"
            }

This option tells the debugger to map /source on the remote to our local path so that our sources our properly found.

Hit F5 to start debugging in the container. The provided launch.json is configured to break on entry so you can immediately see it is working.

IntelliSense for C++ with a container

There are a couple of ways you can setup IntelliSense for use with your C++ code intended for use in a container. Throughout this series of posts we have been using vcpkg to get our libraries. If you use vcpkg on your host system, and have acquired the same libraries using it, then your IntelliSense should work for your libraries.

System headers are another thing. If you are working on Mac or Linux perhaps they are close enough that you are not concerned with configuring this. If you are on Windows, or you want your IntelliSense to exactly match your target system, you will need to get your headers onto your local machine. While your container is running, you can use scp to accomplish this (which is available on Windows 10). Create a directory where you want to save your headers, navigate there in your shell, and run the following command.

scp -r -P 12345 root@localhost:/usr/include .

To get the remote vcpkg headers you can similarly do the following.

scp -r -P 12345 root@localhost:/tmp/vcpkg/installed/x64-linux-musl/include .

As an alternative to scp, you can also use Docker directly to get your headers. For this command the container need not be running.

docker cp -L findfacesvs:/usr/include .

Now you can configure your C++ IntelliSense to use those locations.

Keeping up with your containers

When you are done with your development simply stop the container.

docker stop findfacesvscode

The next time you need it spin it back up.

docker start findfacesvscode

And of course, you need to rerun your multi-stage build to populate your runtime container with your changes.

docker build -t findfaces/run .

Remember that in this example we have our output configured under our source directory on the host. That directory will be copied into the build container if you don’t delete it (which you don’t want), so delete the output directory contents before rebuilding your containers (or adjust your scripts to avoid this issue).

What next

We plan to continue our exploration of containers in future posts. Looking forward, we will introduce a helper container that provides a proxy for our service and to deploy our containers to Azure. We will also revisit this application using Windows containers in the future.

Give us feedback

We’d love to hear from you about what you’d like to see covered in the future about containers. We’re excited to see more people in the C++ community start producing their own content about using C++ with containers. Despite the huge potential for C++ in the cloud with containers, there is very little material out there today.

If you could spare a few minutes to take our C++ cloud and container development survey, it will help us focus on topics that are important to you on the blog and in the form of product improvements.

As always, we welcome your feedback. We can be reached via the comments below or via email (visualcpp@microsoft.com). If you encounter other problems or have a suggestion for Visual Studio please let us know through Help > Send Feedback > Report A Problem / Provide a Suggestion in the product, or via Developer Community. You can also find us on Twitter (@VisualC).


Visual Studio 2019 Preview 2 Blog Rollup

$
0
0

Visual Studio 2019 Preview 2 was a huge release for us, so we’ve written a host of articles to explore the changes in more detail. For the short version, see the Visual Studio 2019 Preview 2 Release Notes.

We’d love for you to download Visual Studio 2019 Preview, give it a try, and let us know how it’s working for you in the comments below or via email (visualcpp@microsoft.com). If you encounter problems or have a suggestion, please let us know through Help > Send Feedback > Report A Problem / Provide a Suggestion or via Visual Studio Developer Community. You can also find us on Twitter @VisualC.

Viewing all 1541 articles
Browse latest View live


<script src="https://jsc.adskeeper.com/r/s/rssing.com.1596347.js" async> </script>