Quantcast
Channel: C++ Team Blog
Viewing all 1541 articles
Browse latest View live

SIMD Extension to C++ OpenMP in Visual Studio

$
0
0

In the era of ubiquitous AI applications there is an emerging demand of the compiler accelerating computation-intensive machine-learning code for existing hardware. Such code usually does mathematical computation like matrix transformation and manipulation and it is usually in the form of loops. The SIMD extension of OpenMP provides users an effortless way to speed up loops by explicitly leveraging the vector unit of modern processors. We are proud to start offering C/C++ OpenMP SIMD vectorization in Visual Studio 2019.

The OpenMP C/C++ application program interface was originally designed to improve application performance by enabling code to be effectively executed in parallel on multiple processors in the 1990s. Over the years the OpenMP standard has been expanded to support additional concepts such as task-based parallelization, SIMD vectorization, and processor offloading. Since 2005, Visual Studio has supported the OpenMP 2.0 standard which focuses on multithreaded parallelization. As the world is moving into an AI era, we see a growing opportunity to improve code quality by expanding support of the OpenMP standard in Visual Studio. We continue our journey in Visual Studio 2019 by adding support for OpenMP SIMD.

OpenMP SIMD, first introduced in the OpenMP 4.0 standard, mainly targets loop vectorization. It is so far the most widely used OpenMP feature in machine learning according to our research. By annotating a loop with an OpenMP SIMD directive, the compiler can ignore vector dependencies and vectorize the loop as much as possible. The compiler respects users’ intention to have multiple loop iterations executed simultaneously.

#pragma omp simd 
for (i = 0; i < count; i++) 
{ 
    a[i] = b[i] + 1; 
}

As you may know, C++ in Visual Studio already provides similar non-OpenMP loop pragmas like #pragma vector and #pragma ivdep. However, the compiler can do more with OpenMP SIMD. For example:

  1. The compiler is always allowed to ignore any vector dependencies that are present.
  2. /fp:fast is enabled within the loop.
  3. Loops with function calls are vectorizable.
  4. Outer loops are vectorizable.
  5. Nested loops can be coalesced into one loop and vectorized.
  6. Hybrid acceleration is achievable with #pragma omp for simd to enable coarse-grained multithreading and fine-grained vectorization.

In addition, the OpenMP SIMD directive can take the following clauses to further enhance the vectorization:

  • simdlen(length) : specify the number of vector lanes
  • safelen(length) : specify the vector dependency distance
  • linear(list[ : linear-step]) : the linear mapping from loop induction variable to array subscription
  • aligned(list[ : alignment]): the alignment of data
  • private(list) : specify data privatization
  • lastprivate(list) : specify data privatization with final value from the last iteration
  • reduction(reduction-identifier : list) : specify customized reduction operations
  • collapse(n) : coalescing loop nest

New -openmp:experimental switch

An OpenMP-SIMD-annotated program can be compiled with a new CL switch -openmp:experimental. This new switch enables additional OpenMP features not available under -openmp. While the name of this switch is “experimental”, the switch itself, and the functionality it enables is fully supported and production-ready. The name reflects that it doesn’t enable any complete subset or version of an OpenMP standard. Future iterations of the compiler may use this switch to enable additional OpenMP features and new OpenMP-related switches may be added. The -openmp:experimental switch subsumes the -openmp switch which means it is compatible with all OpenMP 2.0 features. Note that the SIMD directive and its clauses cannot be compiled with the -openmp switch.

For loops that are not vectorized, the compiler will issue a message for each of them like below. For example,

cl -O2 -openmp:experimental mycode.cpp

mycode.cpp(84) : info C5002: Omp simd loop not vectorized due to reason ‘1200’

mycode.cpp(90) : info C5002: Omp simd loop not vectorized due to reason ‘1200’

For loops that are vectorized, the compiler keeps silent unless a vectorization logging switch is provided:

cl -O2 -openmp:experimental -Qvec-report:2 mycode.cpp

mycode.cpp(84) : info C5002: Omp simd loop not vectorized due to reason ‘1200’

mycode.cpp(90) : info C5002: Omp simd loop not vectorized due to reason ‘1200’

mycode.cpp(96) : info C5001: Omp simd loop vectorized

As the first step of supporting OpenMP SIMD we have basically hooked up the SIMD pragma with the backend vectorizer under the new switch. We focused on vectorizing innermost loops by improving the vectorizer and alias analysis. None of the SIMD clauses are effective in Visual Studio 2019 at the time of this writing. They will be parsed but ignored by the compiler with a warning issued for user’s awareness. For example, the compiler will issue

warning C4849: OpenMP ‘simdlen’ clause ignored in ‘simd’ directive

for the following code:

#pragma omp simd simdlen(8)
for (i = 1; i < count; i++)
{
    a[i] = a[i-1] + 1;
    b[i] = *c + 1;
    bar(i);
}

More about the semantics of OpenMP SIMD directive

The OpenMP SIMD directive provides users a way to dictate the compiler to vectorize a loop. The compiler is allowed to ignore the apparent legality of such vectorization by accepting users’ promise of correctness. It is users’ responsibility when unexpected behavior happens with the vectorization. By annotating a loop with the OpenMP SIMD directive, users intend to have multiple loop iterations executed simultaneously. This gives the compiler a lot of freedom to generate machine code that takes advantage of SIMD or vector resources on the target processor. While the compiler is not responsible for exploring the correctness and profit of such user-specified parallelism, it must still ensure the sequential behavior of a single loop iteration.

For example, the following loop is annotated with the OpenMP SIMD directive. There is no perfect parallelism among loop iterations since there is a backward dependency from a[i] to a[i-1]. But because of the SIMD directive the compiler is still allowed to pack consecutive iterations of the first statement into one vector instruction and run them in parallel.

#pragma omp simd
for (i = 1; i < count; i++)
{
    a[i] = a[i-1] + 1;
    b[i] = *c + 1;
    bar(i);
}

Therefore, the following transformed vector form of the loop is legal because the compiler keeps the sequential behavior of each original loop iteration. In other words, a[i] is executed after a[-1], b[i] is after a[i] and the call to bar happens at last.

#pragma omp simd
for (i = 1; i < count; i+=4)
{
    a[i:i+3] = a[i-1:i+2] + 1;
    b[i:i+3] = *c + 1;
    bar(i);
    bar(i+1);
    bar(i+2);
    bar(i+3);
}

It is illegal to move the memory reference *c out of the loop if it may alias with a[i] or b[i]. It’s also illegal to reorder the statements inside one original iteration if it breaks the sequential dependency. As an example, the following transformed loop is not legal.

c = b;
t = *c;
#pragma omp simd
for (i = 1; i < count; i+=4)
{
    a[i:i+3] = a[i-1:i+2] + 1;
    bar(i);            // illegal to reorder if bar[i] depends on b[i]
    b[i:i+3] = t + 1;  // illegal to move *c out of the loop
    bar(i+1);
    bar(i+2);
    bar(i+3);
}


Future Plans and Feedback

We encourage you to try out this new feature. As always, we welcome your feedback. If you see an OpenMP SIMD loop that you expect to be vectorized, but isn’t or the generated code is not optimal, please let us know. We can be reached via the comments below, via email (visualcpp@microsoft.com), twitter (@visualc) , or via Developer Community.

Moving forward, we’d love to hear your need of OpenMP functionalities missing in Visual Studio. As there have been several major evolutions in OpenMP since the 2.0 standard, OpenMP now has tremendous features to ease your effort to build high-performance programs. For instance, task-based concurrency programming is available starting from OpenMP 3.0. Heterogenous computing (CPU + accelerators) is supported in OpenMP 4.0. Advanced SIMD vectorization and DOACROSS loop parallelization support are also available in the latest OpenMP standard now. Please check out the complete standard revisions and feature sets from the OpenMP official website: https://www.openmp.org. We sincerely ask for your thoughts on the specific OpenMP features you would like to see. We’re also interested in hearing about how you’re using OpenMP to accelerate your code. Your feedback is critical that it will help drive the direction of OpenMP support in Visual Studio.


The post SIMD Extension to C++ OpenMP in Visual Studio appeared first on C++ Team Blog.

Visual Studio Code C/C++ extension: March 2019 Update

$
0
0

The March 2019 update of the Visual Studio Code C/C++ extension is now available. This release includes many new features and bug fixes, including IntelliSense caching, Build and Debug Active File, and configuration squiggles. For a full list of this release’s improvements, check out our release notes on GitHub.

IntelliSense Cache (AutoPCH)

The extension will now cache header information to improve IntelliSense speed. This is similar to precompiled header files in Visual Studio. Please note that IntelliSense caching works on Linux, macOS 10.13+ (High Sierra and later versions), and Windows.

Precompiled Headers (PCH)

Precompiled headers (PCH) can be used with compilers  to speed up build times by taking the #include header files in your code and compiling them for reuse later. Without precompiling headers, IntelliSense needs to process the header files and source code. But, if your header files do not change, it is not actually necessary to process the header files again.

With AuotPCH, the IntelliSense compiler will generate a separate PCH for the use of the IntelliSense compiler. Caching of  PCH files reduces the parsing time of #include header files to improve IntelliSense performance.

IntelliSense Cache Settings

By default, the cached PCH files are currently stored in your workspace folder’s “.vscode” folder under the subdirectory ‘ipch’.  You change this location via the “C_Cpp.intelliSenseCachePath” setting. You can also control how much disk space can be used for the cache with the “C_Cpp.intelliSenseCacheSize” setting. The cached PCH files can be large, depending on the size and number of #include header files. The default cache size (for all files under the C_Cpp.intelliSenseCachePath) is 5120 MB. IntelliSense caching can be disabled by setting the cache size to 0.

Build and Debug Active File

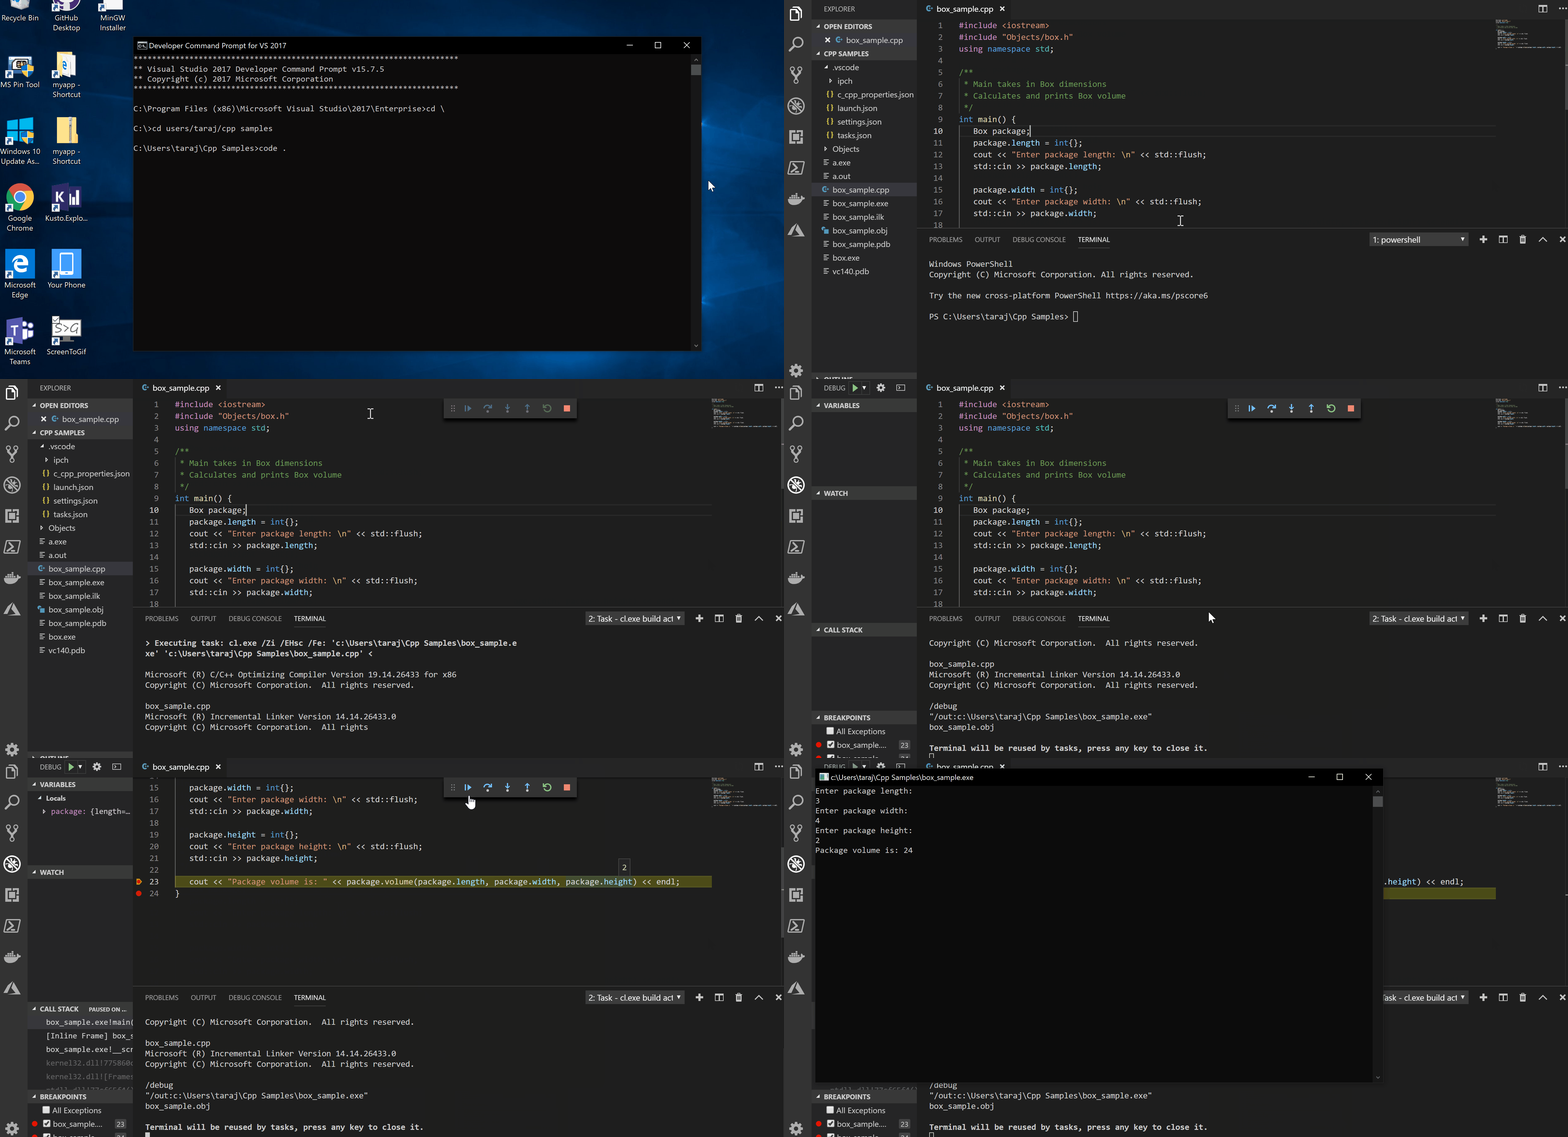
To simplify the build and debug  experience with the C/C++ extension, we added a command to help you generate build and debug tasks for single code files. We write out to your tasks.json and launch.json when you press F5 or select the command from the context menu , which automatically configures the tasks and kicks off a build and debug session . So, you no longer need to go through many of the configuration steps previously required to build and debug your active   Here’s an example with a simple project :

developer command prompt launches VS Code workspace folder. In VS Code open a file and right click in the editor window to see the "build and debug active file" menu option. Selecting the menu option starts a debugger session on the active file.

Please Note: Since this feature writes out tasks.json and launch.json files, it currently requires that a workspace folder be opened first. Using this command will remove comments from the tasks.json and launch.json files. If you are on Windows and wish to use the cl.exe compiler through Visual Studio, you need to open the workspace folder and launch Visual Studio Code from the Developer Command Prompt using the “code .” command.

Configuration Squiggles

On our path to improving the configuration experience, we added additional validation to the c_cpp_properties.json file to assist in diagnosing potential configuration mistakes. These validation checks can be seen with error squiggles . The error squiggles are shown for invalid paths for properties like includePath and compilerPath. We also show error squiggles when a folder is used instead of a file or vice versa. The detected issues will also show up as “Problems” in the problems window:

Changing compiler path to "somePath" generates an error quiggle in the intellisense for the c_cpp_properties.json config file

We will continue improving the configuration experience in future releases.

Tell Us What You Think

Download the C/C++ extension for Visual Studio Code, give it a try, and let us know what you think. If you run into any issues, or have any suggestions, please report them on the  section of our GitHub repository. Set the C_CppProperties.UpdateChannel in your Visual Studio Code settings to “Insiders” to get early builds of our extension. to get early builds of our extension.

Please also take our quick survey to help us shape this extension to meet your needs. We can be reached via the comments below or via email (visualcpp@microsoft.com). You can also find our team on Twitter (@VisualC).

The post Visual Studio Code C/C++ extension: March 2019 Update appeared first on C++ Team Blog.

C++ Productivity Improvements in Visual Studio 2019 Preview 2

$
0
0

Visual Studio 2019 Preview 2 contains a host of productivity features, including some new quick fixes and code navigation improvements:

The Quick Actions menu can be used to select the quick fixes referenced below. You can hover over a squiggle and click the lightbulb that appears or open the menu with Alt + Enter.

Quick Fix: Add missing #include

Have you ever forgotten which header to reference from the C++ Standard Library to use a particular function or symbol? Now, Visual Studio will figure that out for you and offer to fix it:
When you use a type or function defined in a different header, and that header was not #included in the file, Visual Studio squiggles the symbol in red. Now, when you hover over the squiggle, you will be shown an option to automatially add the missing #include.

But this feature doesn’t just find standard library headers. It can tell you about missing headers from your codebase too:
The add missing #include quick fix even works for non-STL headers included in your codebase, so you don't have to remember where you declared everything all the time.

Quick Fix: NULL to nullptr

An automatic quick fix for the NULL->nullptr code analysis warning (C26477: USE_NULLPTR_NOT_CONSTANT) is available via the lightbulb menu on relevant lines, enabled by default in the “C++ Core Check Type Rules,” “C++ Core Check Rules,” and “Microsoft All Rules” rulesets.
It is generally bad practice to use the "NULL" macro in modern C++ code, so Visual Studio will place a squiggle under NULLs. When you hover over such a squiggle, Visual Studio will over to replace it with a nullptr for you.
You’ll be able to see a preview of the change for the fix and can choose to confirm it if it looks good. The code will be fixed automatically and green squiggle removed.

Quick Fix: Add missing semicolon

A common pitfall for students learning C++ is remembering to add the semicolon at the end of a statement. Visual Studio will now identify this issue and offer to fix it.
Visual Studio offers to add missing semicolons to your code where needed. Just hover over the squiggle that appears and choose the option to fix it in the menu.

Quick Fix: Resolve missing namespace or scope

Visual Studio will offer to add a “using namespace” statement to your code if one is missing, or alternatively, offer to qualify the symbol’s scope directly with the scope operator:
When you forget to qualify a type or function with the namespace it comes from, Visual Studio will offer to fill in the missing namespace, along with the scope operator, in the code. Alternatively, you can let Visual Studio insert a "using namespace" statement above the code.
Note: we are currently tracking a bug with the quick fix to add “using namespace” that may cause it to not work correctly – we expect to resolve it in a future update.

Quick Fix: Replace bad indirection operands (* to & and & to *)

Did you ever forget to dereference a pointer and manage to reference it directly instead? Or perhaps you meant to refer to the pointer and not what it points to? This quick action offers to fix such issues:
Visual Studio will offer to correct errors arising from using a * insteaof a & in your code (and vice versa). Hover over the squiggle and choose the corresponding fix to resolve the issue.

Quick Info on closing brace

You can now see a Quick Info tooltip when you hover over a closing brace, giving you some information about the starting line of the code block.
When you hover over a closing brace in Visual Studio, context will be provided about the starting line of the code block.

Peek Header / Code File

Visual Studio already had a feature to toggle between a header and a source C++ file, commonly invoked via Ctrl + K, Ctrl + O, or the right-click context menu in the editor. Now, you can also peek at the other file without leaving your current one with Peek Header / Code File (Ctrl + K, Ctrl + J):
You can peek at the header of a C++ source file with Ctrl + K, Ctrl + J. You can also peek at the source file of a header the same way.

Go to Document on #include

F12 is often used to go to the definition of a code symbol. Now you can also do it on #include directives to open the corresponding file. In the right-click context menu, this is referred to as Go to Document:
You can now press F12 on a #include directive to go to that file in Visual Studio.

Other productivity features to check out

We have several more C++ productivity improvements in Preview 2, covered in separate blog posts:

We want your feedback

We’d love for you to download Visual Studio 2019 and give it a try. As always, we welcome your feedback. We can be reached via the comments below or via email (visualcpp@microsoft.com). If you encounter problems with Visual Studio or MSVC, or have a suggestion for us, please let us know through Help > Send Feedback > Report A Problem / Provide a Suggestion in the product, or via Developer Community. You can also find us on Twitter (@VisualC) and Facebook (msftvisualcpp).

In-editor code analysis in Visual Studio 2019 Preview 2

$
0
0

The C++ team has been working to refresh the Code Analysis experience inside Visual Studio. Last year, we blogged about some in-progress features in this area. We’re happy to announce that in Visual Studio 2019 Preview 2, we’ve integrated code analysis directly into the editor, improved upon previously experimental features, and enabled this as the default experience.

In-editor warnings & background analysis

Code analysis now runs automatically in the background, and warnings display as green squiggles in-editor. Analysis re-runs every time you open a file in the editor and when you save your changes.

If you wish to disable – or re-enable – this feature, you can do so via the Tools > Options > Text Editor > C++ > Experimental > Code Analysis menu, where you’ll also be able to toggle squiggles displaying in-editor or the entire new C++ Code Analysis/Error List experience.

Squiggle display improvements

We’ve also made a few improvements to the display style of in-editor warnings. Squiggles are now only displayed underneath the code segment that is relevant to the warning. If we cannot find the appropriate code segment, we fall back to the Visual Studio 2017 behavior of showing the squiggle for the entire line.

Visual Studio 2017

Visual Studio 2019

We’ve also made performance improvements, especially for source files with many C++ code analysis warnings. Latency from when the file is analyzed until green squiggles appear has been greatly improved, and we’ve also enhanced the overall UI performance during code analysis squiggle display.

Light bulb suggestions & quick fixes

We’ve begun adding light bulb suggestions to provide automatic fixes for warnings. Please see the C++ Productivity Improvements in Visual Studio 2019 Preview 2 blog post for more information.

Send us feedback

Thank you to everyone who helps make Visual Studio a better experience for all. Your feedback is critical in ensuring we can deliver the best Code Analysis experience. We’d love for you to download Visual Studio 2019 Preview 2, give it a try, and let us know how it’s working for you in the comments below or via email (visualcpp@microsoft.com). If you encounter problems or have a suggestion, please let us know through Help > Send Feedback > Report A Problem / Provide a Suggestion or via Visual Studio Developer Community. You can also find us on Twitter @VisualC.

Introducing the New CMake Project Settings UI

$
0
0

Visual Studio 2019 Preview 2 introduces a new CMake Project Settings Editor to help you more easily configure your CMake projects in Visual Studio. The editor provides an alternative to modifying the CMakeSettings.json file directly and allows you to create and manage your CMake configurations.  

If you’re just getting started with CMake in Visual Studio, head over to our CMake Support in Visual Studio introductory page

The new CMake Project Settings Editor

The goal of this editor is to simplify the experience of configuring a CMake project by grouping and promoting commonly used settings, hiding advanced settings, and making it easier to edit CMake variables. This is the first preview of this new UI so we will continue to improve it based on your feedback.  

Open the editor

The CMake Project Settings Editor opens by default when you select “Manage Configurations…” from the configuration drop-down menu at the top of the screen.  

Open the CMake Project Settings Editor by selecting "Manage Connections..." from the configuration drop-down menu at the top of the screen.

You can also right-click on CMakeSettings.json in the Solution Explorer and select “Edit CMake Settings” from the context menu. If you prefer to manage your configurations directly from the CMakeSettings.json file, you can click the link to “Edit JSON” in the top right-hand corner of the editor.  

Configurations sidebar

The left side of the editor contains a configurations sidebar where you can easily toggle between your existing configurations, add a new configuration, and remove configurations. You can also now clone an existing configuration so that the new configuration inherits all properties set by the original. 

The configurations sidebar is on the left side of the editor.

Sections of the editor

The editor contains four sections: General, Command Arguments, CMake Variables and Cache, and Advanced. The General, Command Arguments, and Advanced sections provide a user interface for properties exposed in the CMakeSettings.json file. The Advanced section is hidden by default and can be expanded by clicking the link to “Show advanced settings” at the bottom of the editor.  

The CMake Variables and Cache section provides a new way for you to edit CMake variables. You can click “Save and Generate CMake Cache to Load Variables” to generate the CMake cache and populate a table with all the CMake cache variables available for you to edit. Advanced variables (per the CMake GUI) are hidden by default. You can check “Show Advanced Variables” to show all cache variables or use the search functionality to filter CMake variables by name. 

The CMake Variables and Cache section provides a new way for you to edit CMake variables.

You can change the value of any CMake variable by editing the “Value” column of the table. Modified variables are automatically saved to CMakeSettings.json 

Linux configurations

The CMake Project Settings Editor also provides support for Linux configurations. If you are targeting a remote Linux machine, the editor will expose properties specific to a remote build and link to the Connection Manager, where you can add and remove connections to remote machines.  

CMake Settings support for Linux configurations.

Give us your feedback!

We’d love for you to download Visual Studio 2019 and give it a try. As always, we welcome your feedback. We can be reached via the comments below or via email (visualcpp@microsoft.com). If you encounter other problems with Visual Studio or MSVC or have a suggestion please let us know through Help > Send Feedback > Report A Problem / Provide a Suggestion in the product, or via Developer Community. You can also find us on Twitter (@VisualC) and Facebook (msftvisualcpp). 

Concurrency Code Analysis in Visual Studio 2019

$
0
0

Concurrency Code Analysis in Visual Studio 2019

The battle against concurrency bugs poses a serious challenge to C++ developers. The problem is exacerbated by the advent of multi-core and many-core architectures. To cope with the increasing complexity of multithreaded software, it is essential to employ better tools and processes to help developers adhere to proper locking discipline. In this blog post, we’ll walk through a completely rejuvenated Concurrency Code Analysis toolset we are shipping with Visual Studio 2019 Preview 2.

A perilous landscape

The most popular concurrent programming paradigm in use today is based on threads and locks. Many developers in the industry have invested heavily in multithreaded software. Unfortunately, developing and maintaining multithreaded software is difficult due to a lack of mature multi-threaded software development kits.

Developers routinely face a dilemma in how to use synchronization. Too much may result in deadlocks and sluggish performance. Too little may lead to race conditions and data inconsistency. Worse yet, the Win32 threading model introduces additional pitfalls. Unlike in managed code, lock acquire and lock release operations are not required to be syntactically scoped in C/C++. Applications therefore are vulnerable to mismatched locking errors. Some Win32 APIs have subtle synchronization side effects. For example, the popular “SendMessage” call may induce hangs among UI threads if not used carefully. Because concurrency errors are intermittent, they are among the hardest to catch during testing. When encountered, they are difficult to reproduce and diagnose. Therefore, it is highly beneficial to apply effective multi-threading programming guidelines and tools as early as possible in the engineering process.

Importance of locking disciplines

Because one generally cannot control all corner cases induced by thread interleaving, it is essential to adhere to certain locking disciplines when writing multithreaded programs. For example, following a lock order while acquiring multiple locks or using std::lock() consistently helps to avoid deadlocks; acquiring the proper guarding lock before accessing a shared resource helps to prevent race conditions. However, these seemingly simple locking rules are surprisingly hard to follow in practice.

A fundamental limitation in today’s programming languages is that they do not directly support specifications for concurrency requirements. Programmers can only rely on informal documentation to express their intention regarding lock usage. Thus, developers have a clear need for pragmatic tools that help them confidently apply locking rules.

Concurrency Toolset

To address the deficiency of C/C++ in concurrency support, we had shipped an initial version of concurrency analyzer back in Visual Studio 2012, with promising initial results. This tool had a basic understanding of the most common Win32 locking APIs and concurrency related annotations.

In Visual Studio 2019 Preview 2, we are excited to announce a completely rejuvenated set of concurrency checks to meet the needs of modern C++ programmers. The toolset comprises a local intra-procedural lock analyzer with built-in understanding of common Win32 locking primitives and APIs, RAII locking patterns, and STL locks.

Getting started

The concurrency checks are integrated as part of the code analysis toolset in Visual Studio. The default “Microsoft Native Recommended Ruleset” for the project comprises the following rules from the concurrency analyzer. This means, whenever you run code analysis in your project, these checks are automatically executed. These checks are also automatically executed as part of the background code analysis runs for your project. For each rule, you can click on the link to learn more about the rule and its enforcement with clear examples.

  • C26100: Race condition. Variable should be protected by a lock.
  • C26101: Failing to use interlocked operation properly for a variable.
  • C26110: Caller failing to acquire a lock before calling a function which expects the lock to be acquired prior to being called.
  • C26111: Caller failing to release a lock before calling a function which expects the lock to be released prior to being called.
  • C26112: Caller cannot hold any lock before calling a function which expects no locks be held prior to being called.
  • C26115: Failing to release a lock in a function. This introduces an orphaned lock.
  • C26116: Failing to acquire a lock in a function, which is expected to acquire the lock.
  • C26117: Releasing an unheld lock in a function.
  • C26140: Undefined lock kind specified on the lock.

If you want to try out the full set of rules from this checker, there’s a ruleset just for that. You must right click on Project > Properties > Code Analysis > General > Rulesets > Select “Concurrency Check Rules”.

Screenshot of the Code Analysis properties page that shows the ConcurrencyCheck Rules ruleset selected.

You can learn more about each rule enforced by the checker by searching for rule numbers in the ranges C26100 – C26199 in our Code Analysis for C/C++ warning document.

Concurrency toolset in action

The initial version of concurrency toolset was capable of finding concurrency related issues like race conditions, locking side effects, and potential deadlocks in mostly C-like code.

The tool had in-built understanding of standard Win32 locking APIs. For custom functions with locking side effects, the tool understood a number of concurrency related annotations. These annotations allowed the programmer to express locking behavior. Here are some examples of concurrency related annotations.

  • _Acquires_lock_(lock): Function acquires the lock object “lock”.
  • _Releases_lock_(lock): Function releases the lock object “lock”.
  • _Requires_lock_held_(lock): Lock object “lock” must be acquired before entering this function.
  • _Guarded_by_(lock) data: “data” must always be protected by lock object “lock”.
  • _Post_same_lock(lock1, lock2): “lock1” and “lock2” are aliases.

For a complete set of concurrency related annotations, please see this article Annotating Locking Behavior.

The rejuvenated version of the toolset builds on the strengths of the initial version by extending its analysis capabilities to modern C++ code. For example, it now understands STL locks and RAII patterns without having to add any annotations.

Now that we have talked about how the checker works and how you can enable them in your project, let’s look at some real-world examples.

Example 1

Can you spot an issue with this code1 ?

struct RequestProcessor {​
    CRITICAL_SECTION cs_;​
    std::map<int, Request*> cache_;​
​
    bool HandleRequest(int Id, Request* request) {​
        EnterCriticalSection(&cs_);​
        if (cache_.find(Id) != cache_.end()) ​
            return false;    ​
        cache_[Id] = request;                    ​
        LeaveCriticalSection(&cs_);   ​
    }​
    void DumpRequestStatistics() {​
        for (auto& r : cache_) ​
            std::cout << "name: " << r.second->name << std::endl;​
    }​
};​

1 If you have seen this talk given by Anna Gringauze in CppCon 2018, this code may seem familiar to you.

Let’s summarize what’s going on here:

  1. In function HandleRequest, we acquire lock cs on line 6. However, we return early from line 8 without ever releasing the lock.
  2. In function HandleRequest, we see that cache_ access must be protected by lock cs. However, in a different function, DumpStatistics, we access cache_ without acquiring any lock.

If you run code analysis on this example, you’ll get a warning in method HandleRequest, where it will complain about the leaked critical section (issue #1):

This shows the leaked critical section warning from the concurrency analyzer.

Next, if you add the _Guarded_by_ annotation on the field cache_ and select ruleset “Concurrency Check Rules”, you’ll get an additional warning in method DumpRequestStatistics for the possible race condition (issue #2):

This shows the potential race condition warning from the concurrency analyzer.

Example 2

Let’s look at a more modern example. Can you spot an issue with this code1 ?

struct RequestProcessor2 {​
    std::mutex​ m_;
    std::map<int, Request*> cache_;​
​
    void HandleRequest(int Id, Request* request) {​
        std::lock_guard grab(m_);
        if (cache_.find(Id) != cache_.end()) ​
            return;    ​
        cache_[Id] = request;                    ​
    }​
    void DumpRequestStatistics() {​
        for (auto& r : cache_) ​
            std::cout << "name: " << r.second->name << std::endl;​
    }​
};

As expected, we don’t get any warning in HandleRequest in the above implementation using std::lock_guard. However, we still get a warning in DumpRequestStatistics function:

This shows the potential race condition warning from the concurrency analyzer.

There are a couple of interesting things going on behind the scenes here. First, the checker understands the locking nature of std::mutex. Second, it understands that std::lock_guard holds the mutex and releases it during destruction when its scope ends.

This example demonstrates some of the capabilities of the rejuvenated concurrency checker and its understanding of STL locks and RAII patterns.

Give us feedback

We’d love to hear from you about your experience of using the new concurrency checks. Remember to switch to “Concurrency Check Rules” for your project to explore the full capabilities of the toolset. If there are specific concurrency patterns you’d like us to detect at compile time, please let us know.

If you have suggestions or problems with this check — or any Visual Studio feature — either Report a Problem or post on Developer Community. We’re also on Twitter at @VisualC.

New Code Analysis Checks in Visual Studio 2019: use-after-move and coroutine

$
0
0

New Code Analysis Checks in Visual Studio 2019: use-after-move and coroutine

Visual Studio 2019 Preview 2 is an exciting release for the C++ code analysis team. In this release, we shipped a new set of experimental rules that help you catch bugs in your codebase, namely: use-after-move and coroutine checks. This article provides an overview of the new rules and how you can enable them in your project.

Use-after-move check

C++11 introduced move semantics to help write performant code by replacing some expensive copy operations with cheaper move operations. With the new capabilities of the language, however, we have new ways to make mistakes. It’s important to have the tools to help find and fix these errors.

To understand what these errors are, let’s look at the following code example:

MyType m;
consume(std::move(m));
m.method();

Calling consume will move the internal representation of m. According to the standard, the move constructor must leave m in a valid state so it can be safely destroyed. However, we can’t rely on what that state is. We shouldn’t call any methods on m that have preconditions, but we can safely reassign m, since the assignment operator does not have a precondition on the left-hand side. Therefore, the code above is likely to contain latent bugs. The use after move check is intended to find exactly such code, when we are using a moved-from object in a possibly unintended way.

There are several interesting things happening in the above example:

  • std::move does not actually move m. It’s only cast to a rvalue reference. The actual move happens inside the function consume.
  • The analysis is not inter-procedural, so we will flag the code above even if consume is not actually moving m. This is intentional, since we shouldn’t be using rvalue references when moving is not involved – it’s plain confusing. We recommend rewriting such code in a cleaner way.
  • The check is path sensitive, so it will follow the flow of execution and avoid warning on code like the one below.
    Y y;
    if (condition)
      consume(std::move(y));
    if (!condition)
      y.method();

In our analysis, we basically track what’s happening with the objects.

  • If we reassign a moved-from object it is no longer moved from.
  • Calling a clear function on a container will also cleanse the “moved-from”ness from the container.
  • We even understand what “swap” does, and the code example below works as intended:
    Y y1, y2;
    consume(std::move(y1));
    std::swap(y1, y2);
    y1.method();   // No warning, this is a valid object due to the swap above.
    y2.method();   // Warning, y2 is moved-from.

Coroutine related checks

Coroutines are not standardized yet but they are well on track to become standard. They are the generalizations of procedures and provide us with a useful tool to deal with some concurrency related problems.

In C++, we need to think about the lifetimes of our objects. While this can be a challenging problem on its own, in concurrent programs, it becomes even harder.

The code example below is error prone. Can you spot the problem?

std::future async_coro(int &counter)
{
  Data d = co_await get_data();
  ++counter;
}

This code is safe on its own, but it’s extremely easy to misuse. Let’s look at a potential caller of this function:

int c;
async_coro(c);

The source of the problem is that async_coro is suspended when get_data is called. While it is suspended, the flow of control will return to the caller and the lifetime of the variable c will end. By the time async_coro is resumed the argument reference will point to dangling memory.

To solve this problem, we should either take the argument by value or allocate the integer on the heap and use a shared pointer so its lifetime will not end too early.

A slightly modified version of the code is safe, and we will not warn:

std::future async_coro(int &counter)
{
  ++counter;
  Data d = co_await get_data();
}

Here, we’ll only use the counter before suspending the coroutine. Therefore, there are no lifetime issues in this code. While we don’t warn for the above snippet, we recommend against writing clever code utilizing this behavior since it’s more prone to errors as the code evolves. One might introduce a new use of the argument after the coroutine was suspended.

Let’s look at a more involved example:

int x = 5;
auto bad = [x]() -> std::future {
  co_await coroutine();
  printf("%d\n", x);
};
bad();

In the code above, we capture a variable by value. However, the closure object which contains the captured variable is allocated on the stack. When we call the lambda bad, it will eventually be suspended. At that time, the control flow will return to the caller and the lifetime of captured x will end. By the time the body of the lambda is resumed, the closure object is already gone. Usually, it’s error prone to use captures and coroutines together. We will warn for such usages.

Since coroutines are not part of the standard yet, the semantics of these examples might change in the future. However, the currently implemented version in both Clang and MSVC follows the model described above.

Finally, consider the following code:

generator mutex_acquiring_generator(std::mutex& m) {
  std::lock_guard grab(m);
  co_yield 1;
}

In this snippet, we yield a value while holding a lock. Yielding a value will suspend the coroutine. We can’t be sure how long the coroutine will remain suspended. There’s a chance we will hold the lock for a very long time. To have good performance and avoid deadlocks, we want to keep our critical sections short. We will warn for the code above to help with potential concurrency related problems.

Enabling the new checks in the IDE

Now that we have talked about the new checks, it’s time to see them in action. The section below describes the step-by-step instructions for how to enable the new checks in your project for Preview 2 builds.

To enable these checks, we go through two basic steps. First, we select the appropriate ruleset and second, we run code analysis on our file/project.

Use after free

  1. Select: Project > Properties > Code Analysis > General > C++ Core Check Experimental Rules.
    Screenshot of the Code Analysis properties page that shows the C++ Core Check Experimental Rules ruleset selected.
  2. Run code analysis on the source code by right clicking on File > Analyze > Run code analysis on file.
  3. Observe warning C26800 in the code snippet below:
    Screenshot showing "use of a moved from object" warning

Coroutine related checks

  1. Select: Project > Properties > Code Analysis > General > Concurrency Rules.Screenshot of the Code Analysis properties page that shows the Concurrency Rules ruleset selected.
  2. Run code analysis on the source code by right clicking on File > Analyze > Run code analysis on file.
  3. Observe warning C26810 in the code snippet below:Screenshot showing a warning that the lifetime of a captured variable might end before a coroutine is resumed.
  4. Observe warning C26811 in the code snippet below:Screenshot showing a warning that the lifetime of a variable might end before the coroutine is resumed.
  5. Observe warning C26138 in the code snippet below:Screenshot shows a warning that we are suspending a coroutine while holding a lock.

Wrap Up

We’d love to hear from you about your experience of using these new checks in your codebase, and also for you to tell us what sorts of checks you’d like to see from us in the future releases of VS. If you have suggestions or problems with these checks — or any Visual Studio feature — either Report a Problem or post on Developer Community and let us know. We’re also on Twitter at @VisualC.

Visual Studio Code C/C++ extension: January 2019 Update

$
0
0

The January 2019 update of the Visual Studio Code C++ extension is now available. This release includes many new features and bug fixes including documentation comments support, improved #include autocomplete performance, better member function completion, and many IntelliSense bug fixes. For a full list of this release’s improvements, check out our release notes on Github.

Documentation Comments

We added support for documentation comments for hover, completion, and signature help. You can now see documentation comments in tooltips. Let’s look at a simple box_sample.cpp program that defines a “Box” object with various dimensions.

Class box with lenght, width, height. Function volume that takes in lenght, width, height and returns length * width * height. Main that creates a new Box package and sets length to 2.0, width to 2.0, and height to 4.0. Prints package.volume.

The comment associated with a class or member function is shown in a tooltip when you hover over a place where the class or member function is used. For example, we can see the “Box object” comment in our main function where we create a Box instance:

Hovering over Box provides a tooltip with the comment for the Box member function

#include Autocomplete

This update improves #include autocomplete performance. It now shows individual folders instead of entire paths, thus fixing previous performance issues. When you autocomplete the #include recommendation. In the example below, we modified our original box_sample.cpp program where we place the Box object definition in a separate header file within the “Objects” folder. Now, when we go into our main box_sample.cpp file and see our #include auto-complete suggestion, we see the “Objects” folder auto-complete recommendation.

#include provides an autocomplete suggestion for the Objects folder which contains the box.h header file

Improved Member Function Completion

With improved member function completion, the selected completion is committed after a parenthesis “(“ is entered. This removes the need to accept an autocompletion (using tab, enter, or click) and type the parenthesis. You will now receive the suggested text along with parentheses and the cursor in the middle for a simpler editing experience. Here’s a look at how this works with the “volume” member function for our Box object:

The volume member function in main is completed when you type just "vo" and a "("

This also works for class and member function templates after you type a “<” completion character.

Note that if you accept the autocompletion using tab, enter, or click, we do not currently auto-add the parenthesis.

IntelliSense Bug Fixes

As per customer feedback, we’re continuing to work on bug fixes for IntelliSense. This release we’ve made some IntelliSense fixes including error squiggle improvements, process crash fixes, and increased stability.

You can see additional details of the issues we fixed in our release notes on GitHub.

Tell Us What You Think

Download the C/C++ extension for Visual Studio Code, give it a try, and let us know what you think. If you run into any issues, or have any suggestions, please report them on the Issues section of our GitHub repository. Join our Insiders program to get early builds of our extension.

Please also take our quick survey to help us shape this extension to meet your needs. We can be reached via the comments below or via email (visualcpp@microsoft.com). You can also find us on Twitter (@VisualC).


C++ Binary Compatibility and Pain-Free Upgrades to Visual Studio 2019

$
0
0

Visual Studio 2019 pushes the boundaries of individual and team productivity. We hope that you will find these new capabilities compelling and start your upgrade to Visual Studio 2019 soon.

As you are considering this upgrade, rest assured that Visual Studio 2019 makes it distinctively easy to move your codebase from previous versions of Visual Studio. This post captures the reasons why your upgrade to Visual Studio 2019 will be pain-free.

Side-by-side Visual Studio Installations

You can install the latest version of Visual Studio on a computer that already has an earlier version installed and continue to use both versions in parallel with no interference. This is a great way to try Visual Studio 2019 or adopt it for some of your projects. The Visual Studio Installer will let you manage installations of Visual Studio 2017 and 2019 from a central UI.

Visual Studio Installer image showing VS 2017 and VS 2019 installed side-by-side

MSVC v140 (VS 2015.3) and MSVC v141 (VS 2017) Toolsets in the Visual Studio 2019 IDE

Even if you are not ready yet to move your project to the latest toolset (MSVC v142), you can still load your project in the Visual Studio 2019 IDE and continue to use your current older toolset.

Loading your existing C++ projects into the IDE will not upgrade/change your project files. This way, your projects also load in the previous version of the IDE in case you need to go back or you have teammates that have not yet upgraded to VS 2019 (this functionality is also known as project round-tripping).

Toolsets from older VS installations on your box are visible as platform toolsets in the latest IDE. And if you are starting fresh with only VS 2019 installed on your machine, it is very easy to acquire these older toolsets directly from the Visual Studio Installer by customizing the C++ Desktop workload (with the Individual Components tab listing all the options).

VS Installer Individual Components tab showing the full list of C++ components available in VS 2019

New v142 toolset now available

Within the Visual Studio 2019 wave (previews, its general availability, and future updates), we plan to continue evolving our C++ compilers and libraries with

  • new C++20 features,
  • faster build throughput, and
  • even better codegen optimizations.

The MSVC v142 toolset is now available and it already brings several incentives for you to migrate.

VC Runtime in the latest MSVC v142 toolset is binary compatible with v140 and v141

We heard it loud and clear that a major reason contributing to MSVC v141’s fast adoption today is its binary compatibility with MSVC v140. This allowed you to migrate your own code to the v141 toolset at your own pace, without having to wait for any of your 3rd party library dependencies to migrate first.

We want to keep the momentum going and make sure that you have a similarly successful adoption experience with MSVC v142 too. This is why we’re announcing today that our team is committed to provide binary compatibility for MSVC v142 with both MSVC v141 and v140.

This means that if you compile all your code with the v142 toolset but still have one or more libraries that are built with the v140 or v141 toolset, linking all of it together (with the latest linker) will work as expected. To make this possible, VC Runtime does not change its major version in VS 2019 and remains backward compatible with previous VC Runtime versions.

C:\source\repos\TimerApp\Debug>dumpbin TimerApp2019.exe /IMPORTS | findstr .dll
mfc140ud.dll
KERNEL32.dll
USER32.dll
GDI32.dll
COMCTL32.dll
OLEAUT32.dll
gdiplus.dll
VCRUNTIME140D.dll
ucrtbased.dll
       2EE _seh_filter_dll

When you mix binaries built with different supported versions of the MSVC toolset, there is a version requirement for the VCRedist that you redistribute with your app. Specifically, the VCRedist can’t be older than any of the toolset versions used to build your app.

Hundreds of C++ libraries on Vcpkg are available regardless of the toolset you’re using

If you are using Vcpkg today with VS 2015 or VS 2017 for one or more of your open-source dependencies, you will be happy to learn that these libraries (close to 900 at the time of this writing) can now be compiled with the MSVC v142 toolset and are available for consumption in Visual Studio 2019 projects.

If you are just getting started with Vcpkg, no worries – Vcpkg is an open-source project from Microsoft to help simplify the acquisition and building of open-source C++ libraries on Windows, Linux, and Mac.

Because v142 is binary compatible with v141 and v140, all the packages you’ve already installed will also continue to work in VS 2019 without recompilation; however, we do recommend recompiling when you can so that you can enjoy the new compiler optimizations we’ve added to v142!

If you have VS 2019 Preview installed side-by-side with an older version of VS (e.g. VS 2017), Vcpkg will prefer the stable release, so you will need to set Vcpkg’s triplet variable VCPKG_PLATFORM_TOOLSET to v142 to use the latest MSVC toolset.

MSVC compiler version changes to 19.2x (from 19.1x in MSVC v141)

Last but not least, the compiler part of the MSVC v142 toolset changes its version to 19.20 – only a minor version increment compared with MSVC v141.

VS editor with Quick Info showing that _MSC_VER macro equals 1920
Note that feature-test macros are supported in the MSVC compiler and STL starting with MSVC v141 and they should be the preferred option to enable your code to support multiple MSVC versions.

Call to action

Please download Visual Studio 2019 today and let us know what you think. Our goal is to make your transition to VS 2019 as easy as possible so, as always, we are very interested in your feedback. We can be reached via the comments below or via email (visualcpp@microsoft.com).
If you encounter other problems with Visual Studio or MSVC or have a suggestion please let us know through Help > Send Feedback > Report A Problem / Provide a Suggestion in the product, or via Developer Community. You can also find us on Twitter at @VisualC.

What’s New in CMake – Visual Studio 2019 Preview 2

$
0
0

We have made a bunch of improvements to Visual Studio’s CMake support in the latest preview of the IDE. Many of these changes are taking the first steps to close the gap between working with solutions generated by CMake and the IDE’s native support. Please try out the preview and let us know what you think.

If you are new to CMake in Visual Studio, check out how to get started.

CMake Menu Reorganization

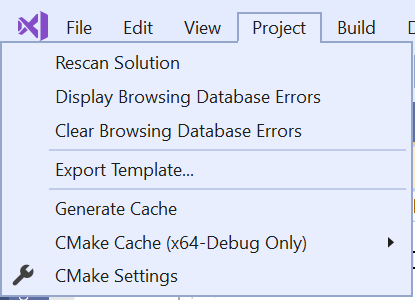
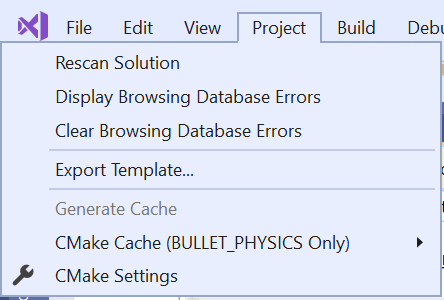
One of the first things you might notice when you open your CMake projects in Visual Studio 2019 Preview 2 is that the CMake menu has disappeared. Don’t worry, nothing is wrong. We just reorganized these items into the existing Project, Build, Debug, and Test menus. For instance, the Project menu now looks like this:

New Project menu with CMake Settings and cache control.

The CMake settings and cache control entries have been moved from the CMake menu to the project menu. Items related to Build, Debug, and Test have been moved accordingly. We hope this reorganization is more intuitive to new users and users who have been using Visual Studio for a long time.

CMake Settings Editor

We received a lot of feedback about the CMakeSettings.json since we first shipped CMake support in Visual Studio. To simplify configuring CMake projects, we have added a graphical editor for CMake Settings.

CMake Settings editor.

You can learn more about the editor here. We would love to hear your feedback about what works well and what doesn’t for your projects. Please try it out and let us know.

Vcpkg Integration

If you have installed vcpkg, CMake projects opened in Visual Studio will automatically integrate the vcpkg toolchain file. This means you don’t have to do any additional configuration to use vcpkg with your CMake projects. This support works for both local vcpkg installations and vcpkg installations on remote machines that you are targeting. This behavior is disabled automatically when you specify any other toolchain in your CMake Settings configuration.

If you are interested in learning more about vcpkg and CMake, stay tuned. A more detailed post about using vcpkg with CMake is coming to the blog soon.

Easier CMake Toolchain Customization

If you use custom CMake toolchain files, configuring your projects just got a little bit easier. Previously, you had to manually specify CMake toolchain files with the “cmakeArgs” parameter in CMakeSettings.json. Now, instead of adding “-DCMAKE_TOOLCHAIN_FILE=…” to the command line you can simply add a “cmakeToolchain” parameter to your configuration in CMake Settings.

The IDE will warn you if you attempt to specify more than one toolchain file.

Automatic Installation of CMake on Linux Targets

Visual Studio’s Linux support for CMake projects requires a recent version of CMake to be installed on the target machine. Often, the version offered by a distribution’s default package manager is not recent enough to support all the IDE’s features. Previously, the only way to work around this was to build CMake from source or install more recent pre-built binaries manually. This was especially painful for users who targeted many Linux machines.

The latest preview of Visual Studio can automatically install a user local copy of CMake on remote Linux machines that don’t have a recent (or any) version of CMake installed. If a compatible version of CMake isn’t detected the first time you build your project, you will see an info-bar asking if you want to install CMake. With one click you will be ready to build and debug on the remote machine.

Support for Just My Code

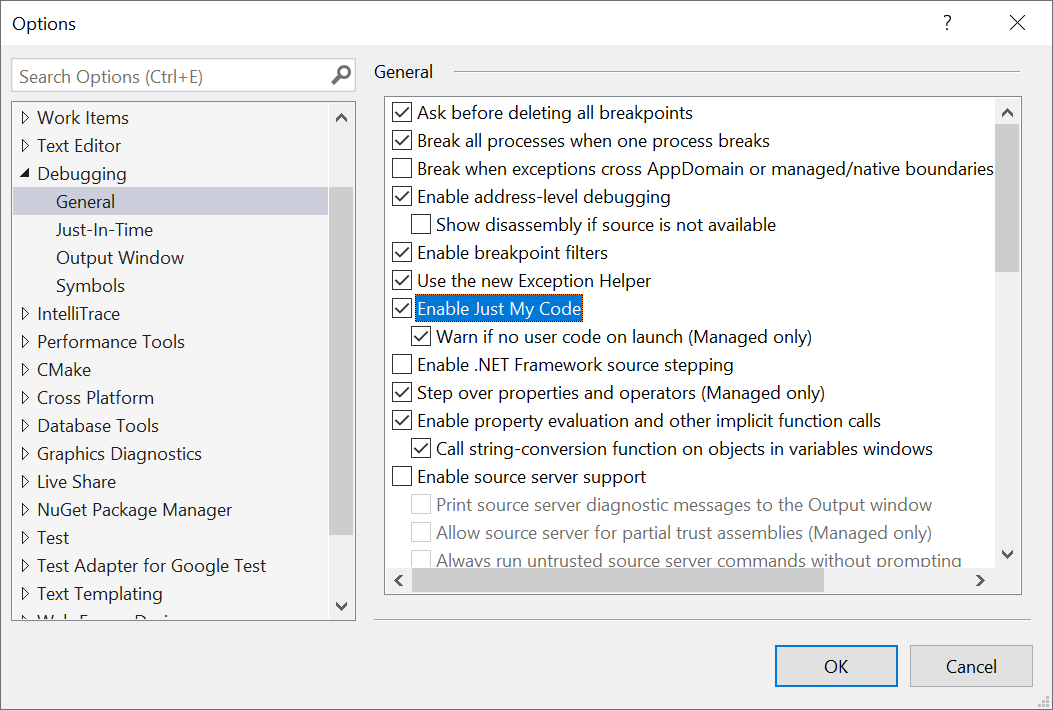
Visual Studio 2019 Preview 2 also adds Just My Code support for CMake projects. If you are building for Windows using the MSVC compiler your CMake projects will now enable Just my Code support in the compiler and linker automatically.

To debug with Just my Code, make sure the feature is enabled in Tools > Options > Debugging > General.

Tools > Options > Debugger > General, "Enable Just My Code."

For now, you will need to use the version of CMake that ships with Visual Studio to get this functionality. This feature will be available for all installations of CMake in an upcoming version. If you need to suppress this behavior for any reason you can modify your CMakeLists to remove the “/JMC” flag from “CMAKE_CXX_FLAGS”.

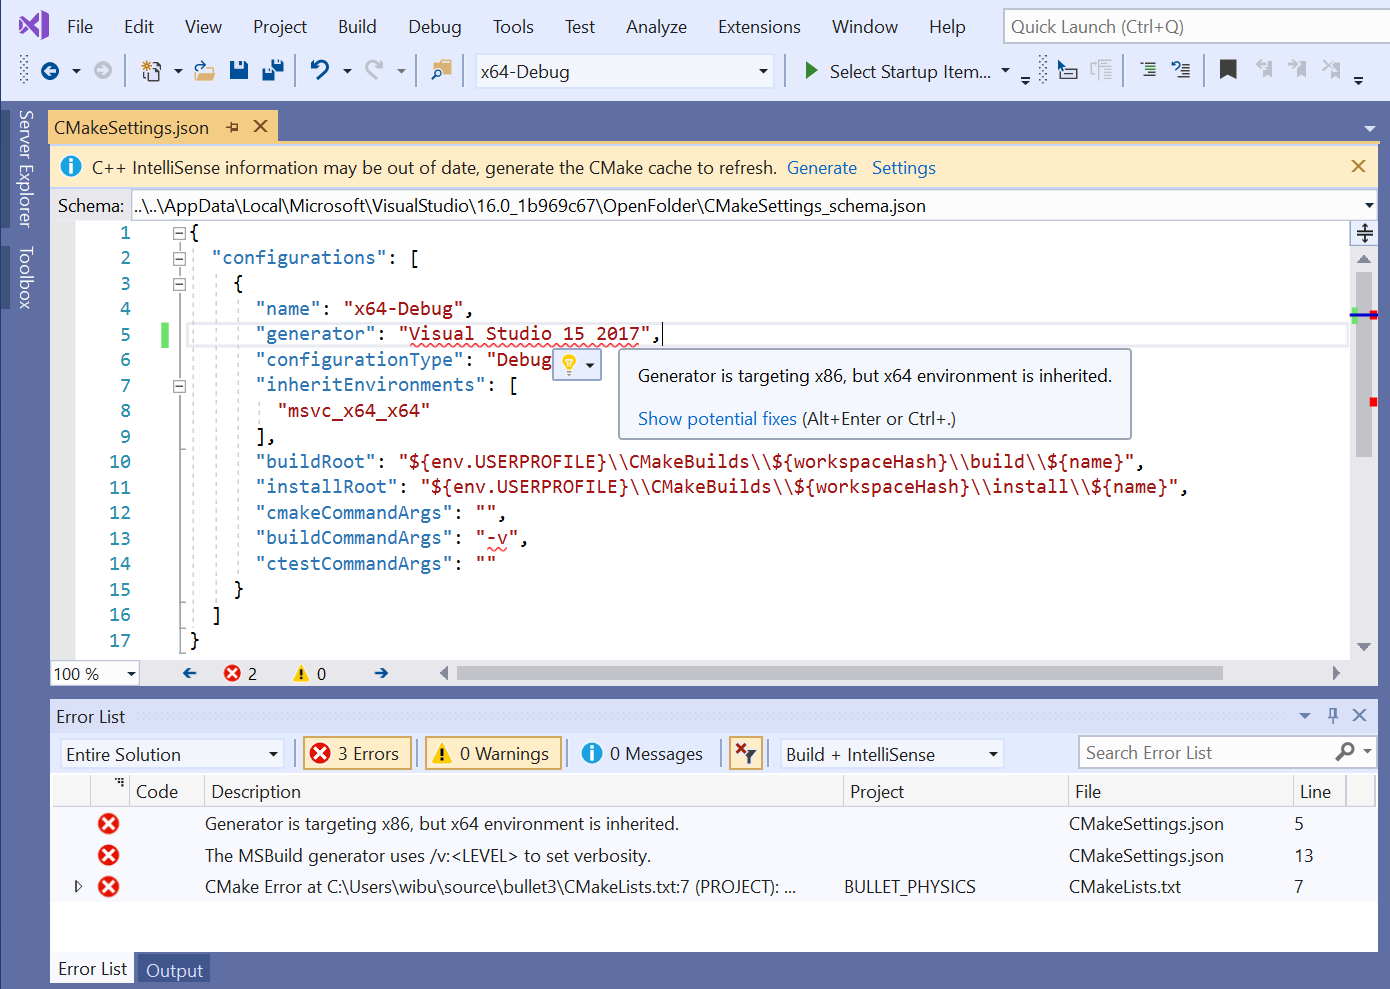
Warnings for Misconfigured CMake Settings

A common source of user feedback and confusion has been the results of choosing incompatible settings for a CMake project’s configuration in CMakeSettings.json. For instance:

  • Using a 32-bit generator with a 64-bit configuration.
  • Using the wrong kind of verbosity syntax in “buildCommandArgs” for the chosen generator.

Warnings for misconfigured CMake Settings.

These misconfigurations are now called out explicitly by the IDE instead of causing CMake configuration failures that can often be difficult to diagnose.

Better Build Feedback and CMake Configure Verbosity

CMake project build and configuration progress is now better integrated into the IDE’s UI. You will see build progress in the status bar when using the Ninja and MSBuild generators.

You also now have more control over the verbosity of messages from CMake during configure. By default, most messages will be suppressed unless there is an error. You can see all messages by enabling this feature in Tools > Options > CMake.

Tools > Options > CMake > General, "Enable verbose CMake diagnostic output."

Send Us Feedback

Your feedback is a critical part of ensuring that we can deliver the best CMake experience.  We would love to know how Visual Studio 2019 Preview is working for you. If you have any feedback specific to CMake Tools, please reach out to cmake@microsoft.com. For general issues please Report a Problem.

Using VS Code for C++ development with containers

$
0
0

This post builds on using multi-stage containers for C++ development. That post showed how to use a single Dockerfile to describe a build stage and a deployment stage resulting in a container optimized for deployment. It did not show you how to use a containers with your development environment. Here we will show how to use those containers with VS Code. The source for this article is the same as that of the previous article: the findfaces GitHub repo.

Creating a container for use with VS Code

VS Code has the capability to target a remote system for debugging. Couple that with a custom build task for compiling in your container and you will have an interactive containerized C++ development environment.

We’ll need to change our container definition a bit to enable using it with VS Code. These instructions are based on some base container definitions that David Ducatel has provided in this GitHub repo. What we’re doing here is taking those techniques and applying them to our own container definition. Let’s look at another Dockerfile for use with VS Code, Dockerfile.vs.

FROM findfaces/build

LABEL description="Container for use with VS"

RUN apk update && apk add --no-cache \
    gdb openssh rsync zip

RUN echo 'PermitRootLogin yes' >> /etc/ssh/sshd_config && \
    echo 'PermitEmptyPasswords yes' >> /etc/ssh/sshd_config && \
    echo 'PasswordAuthentication yes' >> /etc/ssh/sshd_config && \
    ssh-keygen -A

EXPOSE 22 
CMD ["/usr/sbin/sshd", "-D"]

In the FROM statement we’re basing this definition on the local image we created earlier in our multi-stage build. That container already has all our basic development prerequisites, but for VS Code usage we need a few more things enumerated above. Notably, we need SSH for communication with VS Code for debugging which is configured in the RUN command. As we are enabling root login, this container definition is not appropriate for anything other than local development. The entry point for this container is SSH specified in the CMD line. Building this container is simple.

docker build -t findfaces/vs -f Dockerfile.vs .

We need to specify a bit more to run a container based on this image so VS Code can debug processes in it.

docker run -d -p 12345:22 --security-opt seccomp:unconfined -v c:/source/repos/findfaces/src:/source --name findfacesvscode findfaces/vs

One of the new parameters we haven’t covered before is –security-opt. As debugging requires running privileged operations, we’re running the container in unconfined mode. The other new parameter we’re using is -v, which creates a bind mount that maps our local file system into the container. This is so that when we edit files on our host those changes are available in the container without having to rebuild the image or copy them into the running container. If you look at Docker’s documentation, you’ll find that volumes are usually preferred over bind mounts today. However, sharing source code with a container is considered a good use of a bind mount. Note that our build container copied our src directory to /src. Therefore in this container definition we will use interactively we are mapping our local src directory to /source so it doesn’t conflict with what is already present in the build container.

Building C++ in a container with VS Code

First, let’s configure our build task. This task has already been created in tasks.json under the .vscode folder in the repo we’re using with this post. To configure it in a new project, press Ctrl+Shift+B and follow the prompts until you get to “other”. Our configured build task appears as follows.

{
    "version": "2.0.0",
    "tasks": [
        {
            "label": "build",
            "type": "shell",
            "command": "ssh",
            "args": [
                "root@localhost",
                "-p",
                "34568",
                "/source/build.sh"
            ],
            "problemMatcher": [
                "$gcc"
            ]
        }
    ]
}

The “label” value tells VS Code this is our build task and the type that we’re running a command in the shell. The command here is ssh (which is available on Windows 10). The arguments are passing the parameters to ssh to login to the container with the correct port and run a script. The content of that script reads as follows.

cd /source/output && \
cmake .. -DCMAKE_BUILD_TYPE=Debug -DCMAKE_TOOLCHAIN_FILE=/tmp/vcpkg/scripts/buildsystems/vcpkg.cmake -DVCPKG_TARGET_TRIPLET=x64-linux-musl && \
make

You can see that this script just invokes CMake in our output directory, then builds our project. The trick is that we are invoking this via ssh in our container. After this is set up, you can run a build at any time from within VS Code, as long as your container is running.

Debugging C++ in a container with VS Code

To bring up the Debug view click the Debug icon in the Activity Bar. Tasks.json has already been created in the .vscode folder of the repo for this post. To create one in a new project, select the configure icon and follow the prompts to choose any configuration. The configuration we need is not one of the default options, so once you have your tasks.json select Add Configuration and choose C/C++: (gdb) Pipe Launch. The Pipe Launch configuration starts a tunnel, usually SSH, to connect to a remote machine and pipe debug commands through.

You’ll want to modify the following options in the generated Pipe Launch configuration.

            "program": "/source/output/findfaces",
            "args": [],
            "stopAtEntry": true,
            "cwd": "/source/out",

The above parameters in the configuration specify the program to launch on the remote system, any arguments, whether to stop at entry, and what the current working directory on the remote is. The next block shows how to start the pipe.

            "pipeTransport": {
                "debuggerPath": "/usr/bin/gdb",
                "pipeProgram": "C:/Windows/system32/OpenSSH/ssh.exe",
                "pipeArgs": [
                    "root@localhost",
                    "-p",
                    "34568"
                ],
                "pipeCwd": ""
            },

You’ll note here that “pipeProgram” is not just “ssh”, the full path to the executable is required. The path in the example above is the full path to ssh on Windows, it will be different on other systems. The pipe arguments are just the parameters to pass to ssh to start the remote connection. The debugger path option is the default and is correct for this example.
We need to add one new parameter at the end of the configuration.

            "sourceFileMap": {
                "/source": "c:/source/repos/findfaces/src"
            }

This option tells the debugger to map /source on the remote to our local path so that our sources our properly found.

Hit F5 to start debugging in the container. The provided launch.json is configured to break on entry so you can immediately see it is working.

IntelliSense for C++ with a container

There are a couple of ways you can setup IntelliSense for use with your C++ code intended for use in a container. Throughout this series of posts we have been using vcpkg to get our libraries. If you use vcpkg on your host system, and have acquired the same libraries using it, then your IntelliSense should work for your libraries.

System headers are another thing. If you are working on Mac or Linux perhaps they are close enough that you are not concerned with configuring this. If you are on Windows, or you want your IntelliSense to exactly match your target system, you will need to get your headers onto your local machine. While your container is running, you can use scp to accomplish this (which is available on Windows 10). Create a directory where you want to save your headers, navigate there in your shell, and run the following command.

scp -r -P 12345 root@localhost:/usr/include .

To get the remote vcpkg headers you can similarly do the following.

scp -r -P 12345 root@localhost:/tmp/vcpkg/installed/x64-linux-musl/include .

As an alternative to scp, you can also use Docker directly to get your headers. For this command the container need not be running.

docker cp -L findfacesvs:/usr/include .

Now you can configure your C++ IntelliSense to use those locations.

Keeping up with your containers

When you are done with your development simply stop the container.

docker stop findfacesvscode

The next time you need it spin it back up.

docker start findfacesvscode

And of course, you need to rerun your multi-stage build to populate your runtime container with your changes.

docker build -t findfaces/run .

Remember that in this example we have our output configured under our source directory on the host. That directory will be copied into the build container if you don’t delete it (which you don’t want), so delete the output directory contents before rebuilding your containers (or adjust your scripts to avoid this issue).

What next

We plan to continue our exploration of containers in future posts. Looking forward, we will introduce a helper container that provides a proxy for our service and to deploy our containers to Azure. We will also revisit this application using Windows containers in the future.

Give us feedback

We’d love to hear from you about what you’d like to see covered in the future about containers. We’re excited to see more people in the C++ community start producing their own content about using C++ with containers. Despite the huge potential for C++ in the cloud with containers, there is very little material out there today.

If you could spare a few minutes to take our C++ cloud and container development survey, it will help us focus on topics that are important to you on the blog and in the form of product improvements.

As always, we welcome your feedback. We can be reached via the comments below or via email (visualcpp@microsoft.com). If you encounter other problems or have a suggestion for Visual Studio please let us know through Help > Send Feedback > Report A Problem / Provide a Suggestion in the product, or via Developer Community. You can also find us on Twitter (@VisualC).


Visual Studio 2019 Preview 2 Blog Rollup

$
0
0

Visual Studio 2019 Preview 2 was a huge release for us, so we’ve written a host of articles to explore the changes in more detail. For the short version, see the Visual Studio 2019 Preview 2 Release Notes.

We’d love for you to download Visual Studio 2019 Preview, give it a try, and let us know how it’s working for you in the comments below or via email (visualcpp@microsoft.com). If you encounter problems or have a suggestion, please let us know through Help > Send Feedback > Report A Problem / Provide a Suggestion or via Visual Studio Developer Community. You can also find us on Twitter @VisualC.

What’s New in CMake – Visual Studio 2019 Preview 2

$
0
0

We have made a bunch of improvements to Visual Studio’s CMake support in the latest preview of the IDE. Many of these changes are taking the first steps to close the gap between working with solutions generated by CMake and the IDE’s native support. Please try out the preview and let us know what you think.

If you are new to CMake in Visual Studio, check out how to get started.

CMake Menu Reorganization

One of the first things you might notice when you open your CMake projects in Visual Studio 2019 Preview 2 is that the CMake menu has disappeared. Don’t worry, nothing is wrong. We just reorganized these items into the existing Project, Build, Debug, and Test menus. For instance, the Project menu now looks like this:

New Project menu with CMake Settings and cache control.

The CMake settings and cache control entries have been moved from the CMake menu to the project menu. Items related to Build, Debug, and Test have been moved accordingly. We hope this reorganization is more intuitive to new users and users who have been using Visual Studio for a long time.

CMake Settings Editor

We received a lot of feedback about the CMakeSettings.json since we first shipped CMake support in Visual Studio. To simplify configuring CMake projects, we have added a graphical editor for CMake Settings.

CMake Settings editor.

You can learn more about the editor here. We would love to hear your feedback about what works well and what doesn’t for your projects. Please try it out and let us know.

Vcpkg Integration

If you have installed vcpkg, CMake projects opened in Visual Studio will automatically integrate the vcpkg toolchain file. This means you don’t have to do any additional configuration to use vcpkg with your CMake projects. This support works for both local vcpkg installations and vcpkg installations on remote machines that you are targeting. This behavior is disabled automatically when you specify any other toolchain in your CMake Settings configuration.

If you are interested in learning more about vcpkg and CMake, stay tuned. A more detailed post about using vcpkg with CMake is coming to the blog soon.

Easier CMake Toolchain Customization

If you use custom CMake toolchain files, configuring your projects just got a little bit easier. Previously, you had to manually specify CMake toolchain files with the “cmakeArgs” parameter in CMakeSettings.json. Now, instead of adding “-DCMAKE_TOOLCHAIN_FILE=…” to the command line you can simply add a “cmakeToolchain” parameter to your configuration in CMake Settings.

The IDE will warn you if you attempt to specify more than one toolchain file.

Automatic Installation of CMake on Linux Targets

Visual Studio’s Linux support for CMake projects requires a recent version of CMake to be installed on the target machine. Often, the version offered by a distribution’s default package manager is not recent enough to support all the IDE’s features. Previously, the only way to work around this was to build CMake from source or install more recent pre-built binaries manually. This was especially painful for users who targeted many Linux machines.

The latest preview of Visual Studio can automatically install a user local copy of CMake on remote Linux machines that don’t have a recent (or any) version of CMake installed. If a compatible version of CMake isn’t detected the first time you build your project, you will see an info-bar asking if you want to install CMake. With one click you will be ready to build and debug on the remote machine.

Support for Just My Code

Visual Studio 2019 Preview 2 also adds Just My Code support for CMake projects. If you are building for Windows using the MSVC compiler your CMake projects will now enable Just my Code support in the compiler and linker automatically.

To debug with Just my Code, make sure the feature is enabled in Tools > Options > Debugging > General.

Tools > Options > Debugger > General, "Enable Just My Code."

For now, you will need to use the version of CMake that ships with Visual Studio to get this functionality. This feature will be available for all installations of CMake in an upcoming version. If you need to suppress this behavior for any reason you can modify your CMakeLists to remove the “/JMC” flag from “CMAKE_CXX_FLAGS”.

Warnings for Misconfigured CMake Settings

A common source of user feedback and confusion has been the results of choosing incompatible settings for a CMake project’s configuration in CMakeSettings.json. For instance:

  • Using a 32-bit generator with a 64-bit configuration.
  • Using the wrong kind of verbosity syntax in “buildCommandArgs” for the chosen generator.

These misconfigurations are now called out explicitly by the IDE instead of causing CMake configuration failures that can often be difficult to diagnose.

Better Build Feedback and CMake Configure Verbosity

CMake project build and configuration progress is now better integrated into the IDE’s UI. You will see build progress in the status bar when using the Ninja and MSBuild generators.

You also now have more control over the verbosity of messages from CMake during configure. By default, most messages will be suppressed unless there is an error. You can see all messages by enabling this feature in Tools > Options > CMake.

Send Us Feedback

Your feedback is a critical part of ensuring that we can deliver the best CMake experience.  We would love to know how Visual Studio 2019 Preview is working for you. If you have any feedback specific to CMake Tools, please reach out to cmake@microsoft.com. For general issues please Report a Problem.

The post What’s New in CMake – Visual Studio 2019 Preview 2 appeared first on C++ Team Blog.

Using VS Code for C++ development with containers

$
0
0

This post builds on using multi-stage containers for C++ development. That post showed how to use a single Dockerfile to describe a build stage and a deployment stage resulting in a container optimized for deployment. It did not show you how to use a containers with your development environment. Here we will show how to use those containers with VS Code. The source for this article is the same as that of the previous article: the findfaces GitHub repo.

Creating a container for use with VS Code

VS Code has the capability to target a remote system for debugging. Couple that with a custom build task for compiling in your container and you will have an interactive containerized C++ development environment.

We’ll need to change our container definition a bit to enable using it with VS Code. These instructions are based on some base container definitions that David Ducatel has provided in this GitHub repo. What we’re doing here is taking those techniques and applying them to our own container definition. Let’s look at another Dockerfile for use with VS Code, Dockerfile.vs.

FROM findfaces/build

LABEL description="Container for use with VS"

RUN apk update && apk add --no-cache \
    gdb openssh rsync zip

RUN echo 'PermitRootLogin yes' >> /etc/ssh/sshd_config && \
    echo 'PermitEmptyPasswords yes' >> /etc/ssh/sshd_config && \
    echo 'PasswordAuthentication yes' >> /etc/ssh/sshd_config && \
    ssh-keygen -A

EXPOSE 22 
CMD ["/usr/sbin/sshd", "-D"]

In the FROM statement we’re basing this definition on the local image we created earlier in our multi-stage build. That container already has all our basic development prerequisites, but for VS Code usage we need a few more things enumerated above. Notably, we need SSH for communication with VS Code for debugging which is configured in the RUN command. As we are enabling root login, this container definition is not appropriate for anything other than local development. The entry point for this container is SSH specified in the CMD line. Building this container is simple.

docker build -t findfaces/vs -f Dockerfile.vs .

We need to specify a bit more to run a container based on this image so VS Code can debug processes in it.

docker run -d -p 12345:22 --security-opt seccomp:unconfined -v c:/source/repos/findfaces/src:/source --name findfacesvscode findfaces/vs

One of the new parameters we haven’t covered before is –security-opt. As debugging requires running privileged operations, we’re running the container in unconfined mode. The other new parameter we’re using is -v, which creates a bind mount that maps our local file system into the container. This is so that when we edit files on our host those changes are available in the container without having to rebuild the image or copy them into the running container. If you look at Docker’s documentation, you’ll find that volumes are usually preferred over bind mounts today. However, sharing source code with a container is considered a good use of a bind mount. Note that our build container copied our src directory to /src. Therefore in this container definition we will use interactively we are mapping our local src directory to /source so it doesn’t conflict with what is already present in the build container.

Building C++ in a container with VS Code

First, let’s configure our build task. This task has already been created in tasks.json under the .vscode folder in the repo we’re using with this post. To configure it in a new project, press Ctrl+Shift+B and follow the prompts until you get to “other”. Our configured build task appears as follows.

{
    "version": "2.0.0",
    "tasks": [
        {
            "label": "build",
            "type": "shell",
            "command": "ssh",
            "args": [
                "root@localhost",
                "-p",
                "34568",
                "/source/build.sh"
            ],
            "problemMatcher": [
                "$gcc"
            ]
        }
    ]
}

The “label” value tells VS Code this is our build task and the type that we’re running a command in the shell. The command here is ssh (which is available on Windows 10). The arguments are passing the parameters to ssh to login to the container with the correct port and run a script. The content of that script reads as follows.

cd /source/output && \
cmake .. -DCMAKE_BUILD_TYPE=Debug -DCMAKE_TOOLCHAIN_FILE=/tmp/vcpkg/scripts/buildsystems/vcpkg.cmake -DVCPKG_TARGET_TRIPLET=x64-linux-musl && \
make

You can see that this script just invokes CMake in our output directory, then builds our project. The trick is that we are invoking this via ssh in our container. After this is set up, you can run a build at any time from within VS Code, as long as your container is running.

Debugging C++ in a container with VS Code

To bring up the Debug view click the Debug icon in the Activity Bar. Tasks.json has already been created in the .vscode folder of the repo for this post. To create one in a new project, select the configure icon and follow the prompts to choose any configuration. The configuration we need is not one of the default options, so once you have your tasks.json select Add Configuration and choose C/C++: (gdb) Pipe Launch. The Pipe Launch configuration starts a tunnel, usually SSH, to connect to a remote machine and pipe debug commands through.

You’ll want to modify the following options in the generated Pipe Launch configuration.

"program": "/source/output/findfaces",
            "args": [],
            "stopAtEntry": true,
            "cwd": "/source/out",

The above parameters in the configuration specify the program to launch on the remote system, any arguments, whether to stop at entry, and what the current working directory on the remote is. The next block shows how to start the pipe.

"pipeTransport": {
                "debuggerPath": "/usr/bin/gdb",
                "pipeProgram": "C:/Windows/system32/OpenSSH/ssh.exe",
                "pipeArgs": [
                    "root@localhost",
                    "-p",
                    "34568"
                ],
                "pipeCwd": ""
            },

You’ll note here that “pipeProgram” is not just “ssh”, the full path to the executable is required. The path in the example above is the full path to ssh on Windows, it will be different on other systems. The pipe arguments are just the parameters to pass to ssh to start the remote connection. The debugger path option is the default and is correct for this example.
We need to add one new parameter at the end of the configuration.

"sourceFileMap": {
                "/source": "c:/source/repos/findfaces/src"
            }

This option tells the debugger to map /source on the remote to our local path so that our sources our properly found.

Hit F5 to start debugging in the container. The provided launch.json is configured to break on entry so you can immediately see it is working.

IntelliSense for C++ with a container

There are a couple of ways you can setup IntelliSense for use with your C++ code intended for use in a container. Throughout this series of posts we have been using vcpkg to get our libraries. If you use vcpkg on your host system, and have acquired the same libraries using it, then your IntelliSense should work for your libraries.

System headers are another thing. If you are working on Mac or Linux perhaps they are close enough that you are not concerned with configuring this. If you are on Windows, or you want your IntelliSense to exactly match your target system, you will need to get your headers onto your local machine. While your container is running, you can use scp to accomplish this (which is available on Windows 10). Create a directory where you want to save your headers, navigate there in your shell, and run the following command.

scp -r -P 12345 root@localhost:/usr/include .

To get the remote vcpkg headers you can similarly do the following.

scp -r -P 12345 root@localhost:/tmp/vcpkg/installed/x64-linux-musl/include .

As an alternative to scp, you can also use Docker directly to get your headers. For this command the container need not be running.

docker cp -L findfacesvs:/usr/include .

Now you can configure your C++ IntelliSense to use those locations.

Keeping up with your containers

When you are done with your development simply stop the container.

docker stop findfacesvscode

The next time you need it spin it back up.

docker start findfacesvscode

And of course, you need to rerun your multi-stage build to populate your runtime container with your changes.

docker build -t findfaces/run .

Remember that in this example we have our output configured under our source directory on the host. That directory will be copied into the build container if you don’t delete it (which you don’t want), so delete the output directory contents before rebuilding your containers (or adjust your scripts to avoid this issue).

What next

We plan to continue our exploration of containers in future posts. Looking forward, we will introduce a helper container that provides a proxy for our service and to deploy our containers to Azure. We will also revisit this application using Windows containers in the future.

Give us feedback

We’d love to hear from you about what you’d like to see covered in the future about containers. We’re excited to see more people in the C++ community start producing their own content about using C++ with containers. Despite the huge potential for C++ in the cloud with containers, there is very little material out there today.

If you could spare a few minutes to take our C++ cloud and container development survey, it will help us focus on topics that are important to you on the blog and in the form of product improvements.

As always, we welcome your feedback. We can be reached via the comments below or via email (visualcpp@microsoft.com). If you encounter other problems or have a suggestion for Visual Studio please let us know through Help > Send Feedback > Report A Problem / Provide a Suggestion in the product, or via Developer Community. You can also find us on Twitter (@VisualC).

The post Using VS Code for C++ development with containers appeared first on C++ Team Blog.

Visual Studio 2019 Preview 2 Blog Rollup

$
0
0

Visual Studio 2019 Preview 2 was a huge release for us, so we’ve written a host of articles to explore the changes in more detail. For the short version, see the Visual Studio 2019 Preview 2 Release Notes.

We’d love for you to download Visual Studio 2019 Preview, give it a try, and let us know how it’s working for you in the comments below or via email (visualcpp@microsoft.com). If you encounter problems or have a suggestion, please let us know through Help > Send Feedback > Report A Problem / Provide a Suggestion or via Visual Studio Developer Community. You can also find us on Twitter @VisualC.

The post Visual Studio 2019 Preview 2 Blog Rollup appeared first on C++ Team Blog.


Open Existing CMake Caches in Visual Studio

$
0
0

Visual Studio typically manages all the details of CMake for you, under the hood, when you open a project. However, some development workflows require more fine-grained control over how CMake is invoked. The latest Visual Studio 2019 Preview lets you have complete control over CMake if your project needs more flexibility. You can now give your custom or preferred tools complete control of your project’s CMake cache and build tree instead of letting Visual Studio manage it for you.

In Visual Studio 2019 Preview 3, you can open CMake caches by opening a CMakeCache.txt file. This feature may sound familiar if you ever used the previous functionality that would attempt to clone an existing CMake cache. Opening an existing cache is much more powerful; instead of cloning the cache, Visual Studio will operate with the existing cache in place.

When you open an existing cache, Visual Studio will not attempt to manage your cache and build tree for you. Instead, your tools have complete control. This feature supports caches created by any recent version of CMake (3.8 or higher) instead of just the one that ships with Visual Studio.

Why Open a CMake Existing Cache?

When you open a CMake project, Visual Studio manages CMake for you behind the scenes. It will automatically configure the project’s cache and build tree and regenerates the cache when it is out of date due to changes to the project or CMakeSettings. This lets developers get to their code as quickly as possible without needing to worry about the details of CMake itself. Sometimes, however, giving users more control over what CMake is doing makes sense. That is where Open Existing Cache comes in.

Open Existing Cache gives you complete control over how CMake configures your project. This is essential if you use custom build frameworks, meta-build systems, or external tools to drive CMake in your development workflow. For example, if you use a script to set up your project’s environment and build tree, you can now just run that script and open the cache that it generated in Visual Studio. When you open an existing cache, Visual Studio defers to your tooling to manage the cache instead of driving CMake directly.

There are other reasons why you might want to open existing caches as well. For complex projects, the cache might be slow to generate. Now, instead of opening the project and waiting for the cache to configure once again, you can point Visual Studio towards a cache you have already configured. This also can simplify your workflow if you are working with multiple editors or prefer external tools such as CMakeGui to Visual Studio’s CMakeSettings.json to configure your CMake projects.

How Open Existing Cache Works

To get started with an existing cache, first you will need to generate one outside of the IDE. How you do this will depend completely on your development workflow. For example, you might use custom build scripts specific to your project – or a meta-build system that invokes CMake – or maybe external tools such as CMakeGui. If you are interested in trying this out with a sample project, creating a cache with CMakeGui is a good way to get started.

Once you have generated the cache you can open it directly with “File > Open > CMake” by navigating to the CMakeCache.txt file. You will notice that there is no longer a “Import Existing Cache” wizard because the cache is opened directly.

Alternatively, if you have already opened the project in Visual Studio, you can add an existing cache to it the same way you add a new configuration (click “Add Configuration” on the CMakeSettings.json file in the Solution Explorer or right click anywhere in the file’s editor pane):

Once you have done this, the project should behave exactly as if you had opened in Visual Studio and let it manage the cache for you. You should have full IntelliSense, build, and debug support. One thing you may notice, however, is that cache generation is disabled:

Generate isn’t available because Visual Studio doesn’t know how to regenerate the cache yet. If you want Visual Studio to do this for you instead of managing it yourself, it is possible configure Visual Studio to invoke an external tool to regenerate the cache automatically by creating a task.

Configuring External Caches

External caches can be managed in CMakeSettings.json just like any other configuration. When you first open a cache, a CMakeSettings.json file will be generated that looks something like this:

Cache configurations are simple since they mostly defer to other tools to set up the build. The simplest just points to the CMake cache directory with the “cacheRoot” parameter.

You can also mix and match external caches with ones managed by Visual Studio by creating additional configurations.

Remote Caches

You may have noticed that there is also a template to create a configuration for a remote external cache. This allows you to connect to an existing cache on a remote Linux machine. This can be a little trickier to set up than working with one on Windows (we’re still refining this) but it is possible so long as you have the source code on both the local and remote machine.

To open an external cache on a remote machine, first you will need to open the source directory in Visual Studio on the local Windows machine. Next, create a remote external cache configuration from the template and edit the cache with the path of the cache on the remote machine. By default, Visual Studio will not automatically synchronize the source code from local machine to the remote when working with external caches, but you can change this by setting “remoteCopySources” to “true”.

Send Us Feedback

This feature is under active development so please tell us what works well for your projects and what doesn’t. The best way to get in touch with us is to create a feedback or suggestion ticket on Developer Community. Once a ticket is created you can track our progress in fixing the issue. For other feedback or questions feel free to leave a comment or email us at cmake@microsoft.com.

The post Open Existing CMake Caches in Visual Studio appeared first on C++ Team Blog.
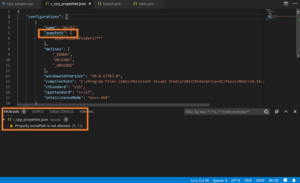
CUDA 10.1 available now, with support for latest Microsoft Visual Studio 2019 versions

$
0
0

We are pleased to echo NVIDIA’s announcement for CUDA 10.1 today, and are particularly excited about CUDA 10.1’s continued compatibility for Visual Studio. CUDA 10.1 will work with RC, RTW and future updates of Visual Studio 2019. To stay committed to our promise for a Pain-free upgrade to any version of Visual Studio 2017 that also carries forward to Visual Studio 2019, we partnered closely with NVIDIA for the past few months to make sure CUDA users can easily migrate between Visual Studio versions. Congratulations to NVIDIA for this milestone and thank you for a great collaboration!

A Bit of Background

In various updates of Visual Studio 2017 (e.g. 15.5) and even earlier major Visual Studio versions, we discovered that some of the library headers became incompatible with CUDA’s NVCC compiler in 9.x versions. The crux of the problem is about two C++ compilers adding modern C++ standard features at different paces but having to work with a common set of C++ headers (e.g. STL headers). We heard from many of you that this issue is forcing you to stay behind on older versions of Visual Studio. Thank you for that feedback. Together with NVIDIA, we have a solution in place that enables all Visual Studio 2017 updates and Visual Studio 2019 versions to work with CUDA 10.0+ tools. This is also reinforced by both sides adding tests and validation processes as part of release quality gates. For example, we continue to run (NVIDIA/Cutlass), a CUDA C++ project, as part of our MSVC Real-World Testing repository as a requirement for shipping. We also have targeted unit tests for PR build validations to guard against potential incompatibility issues.

In closing

We’d love for you to download Visual Studio 2019 RC and try out all the new C++ features and improvements. As always, we welcome your feedback. We can be reached via the comments below or via email (visualcpp@microsoft.com). If you encounter other problems with MSVC in Visual Studio 2019 please let us know through Help > Report A Problem in the product, or via Developer Community. Let us know your suggestions through UserVoice. You can also find us on Twitter (@VisualC) and Facebook (msftvisualcpp).

The post CUDA 10.1 available now, with support for latest Microsoft Visual Studio 2019 versions appeared first on C++ Team Blog.

Making C++ Exception Handling Smaller On x64

$
0
0

Visual Studio 2019 Preview 3 introduces a new feature to reduce the binary size of C++ exception handling (try/catch and automatic destructors) on x64. Dubbed FH4 (for __CxxFrameHandler4, see below), I developed new formatting and processing for data used for C++ exception handling that is ~60% smaller than the existing implementation resulting in overall binary reduction of up to 20% for programs with heavy usage of C++ exception handling.

How Do I Turn This On?

FH4 is currently off by default because the runtime changes required for Store applications could not make it into the current release. To turn FH4 on for non-Store applications, pass the undocumented flag “/d2FH4” to the MSVC compiler in Visual Studio 2019 Preview 3 and beyond.

We plan on enabling FH4 by default once the Store runtime has been updated. We’re hoping to do this in Visual Studio 2019 Update 1 and will update this post once we know more.

Tools Changes

Any installation of Visual Studio 2019 Preview 3 and beyond will have the changes in the compiler and C++ runtime to support FH4. The compiler changes exist internally under the aforementioned “/d2FH4” flag. The C++ runtime sports a new DLL called vcruntime140_1.dll that is automatically installed by VCRedist. This is required to expose the new exception handler __CxxFrameHandler4 that replaces the older __CxxFrameHandler3 routine. Static linking and app-local deployment of the new C++ runtime are both supported as well.

Now onto the fun stuff! The rest of this post will cover the internal results from trialing FH4 on Windows, Office, and SQL, followed by more in-depth technical details behind this new technology.

Motivation and Results

About a year ago, our partners on the C++/WinRT project came to the Microsoft C++ team with a challenge: how much could we reduce the binary size of C++ exception handling for programs that heavily used it?

In context of a program using C++/WinRT, they pointed us to a Windows component Microsoft.UI.Xaml.dll which was known to have a large binary footprint due to C++ exception handling. I confirmed that this was indeed the case and generated the breakdown of binary size with the existing __CxxFrameHandler3, shown below. The percentages in the right side of the chart are percent of total binary size occupied by specific metadata tables and outlined code.

Size Breakdown of Microsoft.UI.Xaml.dll using __CxxFrameHandler3

I won’t discuss in this post what the specific structures on the right side of the chart do (see James McNellis’s talk on how stack unwinding works on Windows for more details). Looking at the total metadata and code however, a whopping 26.4% of the binary size was used by C++ exception handling. This is an enormous amount of space and was hampering adoption of C++/WinRT.

We’ve made changes in the past to reduce the size of C++ exception handling in the compiler without changing the runtime. This includes dropping metadata for regions of code that cannot throw and folding logically identical states. However, we were reaching the end of what we could do in just the compiler and wouldn’t be able to make a significant dent in something this large. Analysis showed that there were significant wins to be had but required fundamental changes in the data, code, and runtime. So we went ahead and did them.

With the new __CxxFrameHandler4 and its accompanying metadata, the size breakdown for Microsoft.UI.XAML.dll is now the following:

Size Breakdown of Microsoft.UI.Xaml.dll using __CxxFrameHandler4

The binary size used by C++ exception handling drops by 64% leading to an overall binary size decrease of 18.6% on this binary. Every type of structure shrank in size by staggering degrees:

EH Data __CxxFrameHandler3 Size (Bytes) __CxxFrameHandler4 Size (Bytes) % Size Reduction
Pdata Entries 147,864 118,260 20.0%
Unwind Codes 224,284 92,810 58.6%
Function Infos 255,440 27,755 89.1%
IP2State Maps 186,944 45,098 75.9%
Unwind Maps 80,952 69,757 13.8%
Catch Handler Maps 52,060 6,147 88.2%
Try Maps 51,960 5,196 90.0%
Dtor Funclets 54,570 45,739 16.2%
Catch Funclets 102,400 4,301 95.8%
Total 1,156,474 415,063 64.1%


Combined, switching to __CxxFrameHandler4 dropped the overall size of Microsoft.UI.Xaml.dll from 4.4 MB down to 3.6 MB.

Trialing FH4 on a representative set of Office binaries shows a ~10% size reduction in DLLs that use exceptions heavily. Even in Word and Excel, which are designed to minimize exception usage, there’s still a meaningful reduction in binary size.

Binary Old Size (MB) New Size (MB) % Size Reduction Description
chart.dll 17.27 15.10 12.6% Support for interacting with charts and graphs
Csi.dll 9.78 8.66 11.4% Support for working with files that are stored in the cloud
Mso20Win32Client.dll 6.07 5.41 11.0% Common code that’s shared between all Office apps
Mso30Win32Client.dll 8.11 7.30 9.9% Common code that’s shared between all Office apps
oart.dll 18.21 16.20 11.0% Graphics features that are shared between Office apps
wwlib.dll 42.15 41.12 2.5% Microsoft Word’s main binary
excel.exe 52.86 50.29 4.9% Microsoft Excel’s main binary


Trialing FH4 on core SQL binaries shows a 4-21% reduction in size, primarily from metadata compression described in the next section:

Binary Old Size (MB) New Size (MB) % Size Reduction Description
sqllang.dll 47.12 44.33 5.9% Top-level services: Language parser, binder, optimizer, and execution engine
sqlmin.dll 48.17 45.83 4.8% Low-level services: transactions and storage engine
qds.dll 1.42 1.33 6.3% Query store functionality
SqlDK.dll 3.19 3.05 4.4% SQL OS abstractions: memory, threads, scheduling, etc.
autoadmin.dll 1.77 1.64 7.3% Database tuning advisor logic
xedetours.dll 0.45 0.36 21.6% Flight data recorder for queries


The Tech

When analyzing what caused the C++ exception handling data to be so large in Microsoft.UI.Xaml.dll I found two primary culprits:

  1. The data structures themselves are large: metadata tables were fixed size with fields of image-relative offsets and integers each four bytes long. A function with a single try/catch and one or two automatic destructors had over 100 bytes of metadata.
  2. The data structures and code generated were not amenable to merging. The metadata tables contained image-relative offsets that prevented COMDAT folding (the process where the linker can fold together identical pieces of data to save space) unless the functions they represented were identical. In addition, catch funclets (outlined code from the program’s catch blocks) could not be folded even if they were code-identical because their metadata is contained in their parents.

To address these issues, FH4 restructures the metadata and code such that:

  1. Previous fixed sized values have been compressed using a variable-length integer encoding that drops >90% of the metadata fields from four bytes down to one. Metadata tables are now also variable length with a header to indicate if certain fields are present to save space on emitting empty fields.
  2. All image-relative offsets that can be function-relative have been made function-relative. This allows COMDAT folding between metadata of different functions with similar characteristics (think template instantiations) and allows these values to be compressed. Catch funclets have been redesigned to no longer have their metadata stored in their parents’ so that any code-identical catch funclets can now be folded to a single copy in the binary.

To illustrate this, let’s look at the original definition for the Function Info metadata table used for __CxxFrameHandler3. This is the starting table for the runtime when processing EH and points to the other metadata tables. This code is available publicly in any VS installation, look for <VS install path>\VC\Tools\MSVC\<version>\include\ehdata.h:

typedef const struct _s_FuncInfo
{
    unsigned int        magicNumber:29;     // Identifies version of compiler
    unsigned int        bbtFlags:3;         // flags that may be set by BBT processing
    __ehstate_t         maxState;           // Highest state number plus one (thus
                                            // number of entries in unwind map)
    int                 dispUnwindMap;      // Image relative offset of the unwind map
    unsigned int        nTryBlocks;         // Number of 'try' blocks in this function
    int                 dispTryBlockMap;    // Image relative offset of the handler map
    unsigned int        nIPMapEntries;      // # entries in the IP-to-state map. NYI (reserved)
    int                 dispIPtoStateMap;   // Image relative offset of the IP to state map
    int                 dispUwindHelp;      // Displacement of unwind helpers from base
    int                 dispESTypeList;     // Image relative list of types for exception specifications
    int                 EHFlags;            // Flags for some features.
} FuncInfo;

This structure is fixed size containing 10 fields each 4 bytes long. This means every function that needs C++ exception handling by default incurs 40 bytes of metadata.

Now to the new data structure (<VS install path>\VC\Tools\MSVC\<version>\include\ehdata4_export.h):

struct FuncInfoHeader
{
    union
    {
        struct
        {
            uint8_t isCatch     : 1;  // 1 if this represents a catch funclet, 0 otherwise
            uint8_t isSeparated : 1;  // 1 if this function has separated code segments, 0 otherwise
            uint8_t BBT         : 1;  // Flags set by Basic Block Transformations
            uint8_t UnwindMap   : 1;  // Existence of Unwind Map RVA
            uint8_t TryBlockMap : 1;  // Existence of Try Block Map RVA
            uint8_t EHs         : 1;  // EHs flag set
            uint8_t NoExcept    : 1;  // NoExcept flag set
            uint8_t reserved    : 1;
        };
        uint8_t value;
    };
};


struct FuncInfo4
{
    FuncInfoHeader header;
    uint32_t bbtFlags;         // flags that may be set by BBT processing


    int32_t  dispUnwindMap;    // Image relative offset of the unwind map
    int32_t  dispTryBlockMap;  // Image relative offset of the handler map
    int32_t  dispIPtoStateMap; // Image relative offset of the IP to state map
    uint32_t dispFrame;        // displacement of address of function frame wrt establisher frame, only used for catch funclets
};

Notice that:

  1. The magic number has been removed, emitting 0x19930522 every time becomes a problem when a program has thousands of these entries.
  2. EHFlags has been moved into the header while dispESTypeList has been phased out due to dropped support of dynamic exception specifications in C++17. The compiler will default to the older __CxxFrameHandler3 if dynamic exception specifications are used.
  3. The lengths of the other tables are no longer stored in “Function Info 4”. This allows COMDAT folding to fold more of the pointed-to tables even if the “Function Info 4” table itself cannot be folded.
  4. (Not explicitly shown) The dispFrame and bbtFlags fields are now variable-length integers. The high-level representation leaves it as an uint32_t for easy processing.
  5. bbtFlags, dispUnwindMap, dispTryBlockMap, and dispFrame can be omitted depending on the fields set in the header.

Taking all this into account, the average size of the new “Function Info 4” structure is now 13 bytes (1 byte header + three 4 byte image relative offsets to other tables) which can scale down even further if some tables are not needed. The lengths of the tables were moved out, but these values are now compressed and 90% of them in Microsoft.UI.Xaml.dll were found to fit within a single byte. Putting that all together, this means the average size to represent the same functional data in the new handler is 16 bytes compared to the previous 40 bytes—quite a dramatic improvement!

For folding, let’s look at the number of unique tables and funclets with the old and new handler:

EH Data Count in __CxxFrameHandler3 Count in __CxxFrameHandler4 % Reduction
Pdata Entries 12,322 9,855 20.0%
Function Infos 6,386 2,747 57.0%
IP2State Map Entries 6,363 2,148 66.2%
Unwind Map Entries 1,487 1,464 1.5%
Catch Handler Maps 2,603 601 76.9%
Try Maps 2,598 648 75.1%
Dtor Funclets 2,301 1,527 33.6%
Catch Funclets 2,603 84 96.8%
Total 36,663 19,074 48.0%


The number of unique EH data entries drops by 48% from creating additional folding opportunities by removing RVAs and redesigning catch funclets. I specifically want to call out the number of catch funclets italicized in green: it drops from 2,603 down to only 84. This is a consequence of C++/WinRT translating HRESULTs to C++ exceptions which generates plenty of code-identical catch funclets that can now be folded. Certainly a drop of this magnitude is on the high-end of outcomes but nevertheless demonstrates the potential size savings folding can achieve when the data structures are designed with it in mind.

Performance

With the design introducing compression and modifying runtime execution there was a concern of exception handling performance being impacted. The impact, however, is a positive one: exception handling performance improves with __CxxFrameHandler4 as opposed to __CxxFrameHandler3. I tested throughput using a benchmark program that unwinds through 100 stack frames each with a try/catch and 3 automatic objects to destruct. This was run 50,000 times to profile execution time, leading to overall execution times of:

__CxxFrameHandler3 __CxxFrameHandler4
Execution Time 4.84s 4.25s


Profiling showed decompression does introduce additional processing time but its cost is outweighed by fewer stores to thread-local storage in the new runtime design.

Future Plans

As mentioned in the title, FH4 is currently only enabled for x64 binaries. However, the techniques described are extensible to ARM32/ARM64 and to a lesser extent x86. We’re currently looking for good examples (like Microsoft.UI.Xaml.dll) to motivate extending this technology to other platforms—if you think you have a good use case let us know!

The process of integrating the runtime changes for Store applications to support FH4 is in flight. Once that’s done, the new handler will be enabled by default so that everyone can get these binary size savings with no additional effort.

Closing Remarks

For anybody who thinks their x64 binaries could do with some trimming down: try out FH4 (via ‘/d2FH4’) today! We’re excited to see what savings this can provide now that this feature is out in the wild. Of course, if you encounter any issues please let us know in the comments below, by e-mail (visualcpp@microsoft.com), or through Developer Community. You can also find us on Twitter (@VisualC).

Thanks to Kenny Kerr for directing us to Microsoft.UI.Xaml.dll, Ravi Pinjala for gathering the numbers on Office, and Robert Roessler for trialing this out on SQL.


The post Making C++ Exception Handling Smaller On x64 appeared first on C++ Team Blog.

Game performance and compilation time improvements in Visual Studio 2019

$
0
0

The C++ compiler in Visual Studio 2019 includes several new optimizations and improvements geared towards increasing the performance of games and making game developers more productive by reducing the compilation time of large projects. Although the focus of this blog post is on the game industry, these improvements apply to most C++ applications and C++ developers.

Compilation time improvements

One of the focus points of the C++ toolset team in the VS 2019 release is improving linking time, which in turn allows faster iteration builds and quicker debugging. Two significant changes to the linker help speed up the generation of debug information (PDB files):

  • Type pruning in the backend removes type information that is not referenced by any variables and reduces the amount of work the linker must do during type merging.
  • Speed up type merging by using a fast hash function to identify identical types.

The table below shows the speedup measured in linking a large, popular AAA game:

Debug build
configuration

Linking time (sec)
VS 2017 (15.9)
Linking time (sec)
VS 2019 (16.0)
Linking time speedup
/DEBUG:full

392.1

163.3

2.40x

/DEBUG:fastlink 72.3 31.2

2.32x


More details and additional benchmarks can be found in this blog post.

Vector (SIMD) expression optimizations

One of the most significant improvements in the code optimizer is handling of vector (SIMD) intrinsics, both from source code and as a result of automated vectorization. In VS 2017 and prior, most vector operations would go through the main optimizer without any special handling, similar to function calls, although they are represented as intrinsics – special functions known to the compiler. Starting with VS 2019, most expressions involving vector intrinsics are optimized just like regular integer/float code using the SSA optimizer.

Both float (eg. _mm_add_ps) and integer (eg. _mm_add_epi32) versions of the intrinsics are supported, targeting the SSE/SSE2 and AVX/AVX2 instruction sets. Some of the performed optimizations, among many others:

  • constant folding
  • arithmetic simplifications, including reassociation
  • handling of cmp, min/max, abs, extract operations
  • converting vector to scalar operations if profitable
  • patterns for shuffle and pack operations

Other optimizations, such as common sub-expression elimination, can now take advantage of a better understanding of load/store vector operations, which are handled like regular loads/stores. Several ways of initializing a vector register are recognized and the values are used during the expression simplifications (eg. _mm_set_ps, _mm_set_ps1, _mm_setr_ps, _mm_setzero_ps for float values).

Another important addition is the generation of fused multiply-add (FMA) for vector intrinsics when the /arch:AVX2 compiler flag is used – previously it was done only for scalar float code. This allows the CPU to compute the expression a*b + c in fewer cycles, which can be a significant speedup in math-heavy code, as one of the examples below is showing.

The following code exemplifies both the generation of FMA with /arch:AVX2 and the expression optimizations when /fp:fast is used:

__m128 test(float a, float b) {
    __m128 va = _mm_set1_ps(a);
    __m128 vb = _mm_set1_ps(b);
    __m128 vd = _mm_set1_ps(-b);

    // Computes (va * vb) + (va * -vb)
    return _mm_add_ps(_mm_mul_ps(va, vb),_mm_mul_ps(va, vd));
}

No simplifications are done; FMA not generated.

VS 2017 /arch:AVX2 /fp:fast
vmovaps xmm3, xmm0
vbroadcastss xmm3, xmm0

vxorps xmm0, xmm1, DWORD PTR __xmm@80000000800000008000000080000000
vbroadcastss xmm0, xmm0
vmulps xmm2, xmm0, xmm3
vbroadcastss xmm1, xmm1
vmulps xmm0, xmm1, xmm3
vaddps xmm0, xmm2, xmm0
ret 0
No simplifications done – not legal under /fp:precise; FMA generated. VS 2019 /arch:AVX2
vmovaps xmm2, xmm0
vbroadcastss xmm2, xmm0
vmovaps xmm0, xmm1
vbroadcastss xmm0, xmm1
vxorps xmm1, xmm1, DWORD PTR __xmm@80000000800000008000000080000000
vbroadcastss xmm1, xmm1
vmulps xmm0, xmm0, xmm2
vfmadd231ps xmm0, xmm1, xmm2
ret 0
Entire expression simplified to “return 0” since /fp:fast allows applying the usual arithmetic rules. VS 2019 /arch:AVX2 /fp:fast

vxorps xmm0, xmm0, xmm0
ret 0


More examples can be found in this older blog post, which discusses the SIMD generation of several compilers – VS 2019 now handles all the cases as expected, and a lot more!

Benchmarking the vector optimizations

For measuring the benefit of the vector optimizations, Xbox ATG (Advanced Technology Group) provided a benchmark based on code from Unreal Engine 4 for commonly used mathematical operations, such as SIMD expressions, vector/matrix transformations and sin/cos/sqrt functions. The tests are a combination of cases where the values are constants and cases where the values are unknown at compile time. This tests the common scenario where the values are not known at compile-time, but also the situation that arises usually after inlining when some values turn out to be constants.

The table below shows the speedup of the tests grouped into four categories, the execution time (milliseconds) being the sum of all tests in the category. The next table shows the improvements for a few individual tests when using unknown, random values – the versions that use constants are folded now as expected.

Category

VS 2017 (ms) VS 2019 (ms)

Speedup

Math 482 366 27.36%
Vector 337 238 34.43%
Matrix 3168 3158 0.32%
Trigonometry 3268 1882 53.83%


Test

VS 2017 (ms) VS 2019 (ms)

Speedup

VectorDot3

42

39

7.4%

MatrixMultiply

204

194

5%

VectorCRTSin

421

402

4.6%

NormalizeSqrt

82

77

7.4%

NormalizeInvSqrt

106

97

8.8%


Improvements in Unreal Engine 4 – Infiltrator Demo

To ensure that our efforts benefit actual games and not just micro-benchmarks, we used the Infiltrator Demo as a representative for an AAA game based on Unreal Engine 4.21. Being mostly a cinematic sequence rendered in real-time, with complex graphics, animations and physics, the execution profile is similar to an actual game; at the same time it is a great target for getting the stable, reproducible results needed to investigate performance and measure the impact of compiler improvements.

The main way of measuring a game’s performance is using the frame time. Frame times can be viewed as the inverse of FPS (frames per second), representing the time it takes to prepare one frame to be displayed, lower values being better. The two main threads in Unreal Engine are the gaming thread and rendering thread – this work focuses mostly on the gaming thread performance.

There are four builds being tested, all based on the default Unreal Engine settings, which use unity (jumbo) builds and have /fp:fast /favor:AMD64 enabled. Note that the AVX2 instruction set is being used, except for one build that keeps the default AVX:

  • VS 2017 (15.9) with /arch:AVX2
  • VS 2019 (16.0) with /arch:AVX2
  • VS 2019 (16.0) with /arch:AVX2 and /LTCG, to showcase the benefit
    of using link time code generation
  • VS 2019 (16.0) with /arch:AVX, to showcase the benefit of using AVX2 over AVX

Testing details:

  • To capture frame times, a custom ETW provider was integrated into the game to report the values to Xperf running in the background. Each build of the game has one warm-up run, then 10 runs of the entire game with ETW tracing enabled. The final frame time is computed, for each 0.5 second interval, as the average of these 10 runs. The process is automated by a script that starts the game once and after each iteration restarts the level from the beginning. Out of the 210 seconds (3:30m) long demo, the first 170 seconds are captured.
  • Test PC configuration:
    • AMD Ryzen 2700x CPU (8 cores/16 threads) fixed at 3.4Ghz to eliminate potential noise in the measurements from dynamic frequency scaling
    • AMD Radeon RX 470 GPU
    • 32 GB DDR4-2400 RAM
    • Windows 10 1809
  • The game runs at a resolution of 640×480 to reduce the impact the GPU rendering has

Results:

The chart below shows the measured frame times up to second 170 for the four tested builds of the game. Frame time ranges from 4ms to 15ms in the more graphic intensive part around seconds 155-165. To make the difference between builds more obvious, the “fastest” and “slowest” sections are zoomed in. As mentioned before, a lower frame time value is better.

Graph showing the frame time over the duration of the game

The following table summarizes the results, both as an average over the entire game and by focusing on the “slow” section, where the largest improvement can be seen:

Improvement

VS 2019 AVX2
vs. VS 2017 AVX2
VS 2019 LTCG AVX2
vs. VS 2019 AVX2
VS 2019 AVX
vs. VS 2019 AVX2

Average

0.7%

0.9%

-1.8%

Largest 2.8% 3.2%

-8.5%


  • VS 2019 improves frame time up to 2.8% over VS 2017
  • An LTCG build improves frame time up to 3.2% compared to the default unity build
  • Using AVX2 over AVX shows a significant frame time improvement, up to 8.5%, in large part a result of the compiler automatically generating FMA instructions for scalar, and now in 16.0, vector operations.

The performance in different parts of the game can be seen easier by computing the speedup of one build relative to another, as a percentage. The following charts show the results when comparing the frame times for the 16.0/15.9 and AVX/AVX2 builds – the X axis is the time in the game, Y axis is the frame time improvement percentage: Image showing the improvement between 16.0 and 15.9

Image showing the improvement between 16.0 AVX2 and 16.0 AVX

More optimizations

Besides the vector instruction optimizations, VS 2019 has several new optimizations that help both games and C++ programs in general:

  • Useless struct/class copies are being removed in several more cases, including copies to output parameters and functions returning an object. This optimization is especially effective in C++ programs that pass objects by value.
  • Added a more powerful analysis for extracting information about variables from control flow (if/else/switch statements), used to remove branches that can be proven to be always true or false and to improve the variable range estimation.
  • Unrolled, constant-length memsets will now use 16-byte store instructions (or 32 byte for /arch:AVX).
  • Several new scalar FMA patterns are identified with /arch:AVX2. These include the following common expressions: (x + 1.0) * y; (x – 1.0) * y; (1.0 – x) * y; (-1.0 – x) * y.
  • A more comprehensive list of backend improvements can be found in this blog post.


We’d love for you to download Visual Studio 2019 and give it a try. As always, we welcome your feedback. We can be reached via the comments below or via email (visualcpp@microsoft.com). If you encounter problems with Visual Studio or MSVC, or have a suggestion for us, please let us know through Help > Send Feedback > Report A Problem / Provide a Suggestion in the product, or via Developer Community. You can also find us on Twitter (@VisualC) and Facebook (msftvisualcpp).

The post Game performance and compilation time improvements in Visual Studio 2019 appeared first on C++ Team Blog.

Linker Throughput Improvement in Visual Studio 2019

$
0
0

In Visual Studio 2019 Preview 2 we made the compiler back-end to prune away debug information that is unrelated to code or data emitted into binary and changed certain hash implementations in the PDB engine, to improve linker throughput, which resulted in more than 2x reduction on link time for some large AAA game title.

Debug Info Pruning

This is to have the compiler back-end prune away debug info of any user defined types (UDTs) that are not referenced by any symbol record. This cuts down the size of OBJ sections holding debug info, like .debug$S which holds debug records for symbols and .debug$T which holds debug records for types if /Z7 is used. When /Zi or /ZI is used, the compiler will write debug info for types into one PDB file which is usually set to be shared by multiple compilations of all source files under one directory. In this case we don’t prune away types from the compiler generated PDB but will only remove S_UDT records from the .debug$S sections if underlying UDTs are not referenced by any symbol. With smaller debug sections in OBJs and LIBs there is less work to do on type merging and symbol processing when to generate PDB, and therefore it speeds up linking because PDB generation usually takes the majority of link time. The linker aggressively does memory mapped file I/O, and therefore smaller OBJs and LIBs alleviate pressure on virtual memory, which is crucial for link speed when working on big binaries like those in game development.

Type pruning done by the compiler is not free and degrades compilation throughput, especially when the compiler needs to generate a PDB under option /Zi or /ZI and the PDB server (mspdbsrv.exe) is in use for some reason, like the use of /MP or in a smart build system where the build driver kicks off multiple compilations targeting the same PDB file at one time. Since linking is usually the biggest bottleneck in build throughput, we have made type pruning on by default when mspdbsrv.exe is not used in compilation. We think this is a good tradeoff, since compilations can be easily done in parallel. And in development iteration (edit-build-debug) cycle, where usually only a small portion of source files need to be re-compiled, link time becomes dominating in overall build time. If you want to force enabling it in the case where mspdbsrv.exe will be involved, add compiler option /d2prunedbinfo.

Type and Global Symbol Hash Improvement in PDB

The PDB file stores various hashes on types for convenience of adding new type records into an existing PDB file and for type querying at debug or profile time. The PDB file format has been around for more than 25 years and there are lots of tools built by Microsoft and other companies that deal with PDBs. While the type hashes in today’s PDB are inefficient to handle a large amount of types, we don’t want to simply switch to an efficient hash with different structures, so to maintain compatibility on PDB format. In Preview 2 we use xxhash to check whether a given type is unique. When type merging is done and it is time to commit everything into PDB file on disk, we then rebuild the hashes used in today’s PDB file and write them out. xxhash is extremely fast. Though it doesn’t meet the security requirement for cryptographic applications, the hash function has a good measure of quality and we use it here only for uniqueness checking.

Similar to how type merging throughput is improved, we now make the linker communicate the number of public symbols to PDB, so the PDB engine can set up a hash table with a sufficient number of buckets which results in far fewer hash collisions. Same as type merging, we need to convert the in-memory version of hash into on-disk format before committing it into PDB.

In Preview 2 the improvements on internal PDB hashes are only effective when generating a PDB from scratch, since reading records out of an existing PDB and rebuilding fast in-memory version of hashes is expensive, the overhead of which offsets possible gain resulted from processing types and symbols with fast hashes.

Results

Here is the comparison between the latest Visual Studio 2017 15.9 Update release and Visual Studio 2019 Preview 2. We built one AAA game title and Google’s Chrome. In the tables below, the first two rows with numbers are for link time in the unit of seconds and the last row is for size of total input to the linker in the unit of bytes:

AAA Game Title
Link time (seconds) VS 2017 15.9 Update (base) VS 2019 Preview 2 (diff) base/diff (higher is better)
/DEBUG:full 392.1 163.3 2.4
/DEBUG:fastlink 72.3 31.2 2.32
Input size (bytes) 12,882,624,412 8,131,565,290 1.58


Google Chrome (x64 release build)
Link time (seconds) VS 2017 15.9 Update (base) VS 2019 Preview 2 (diff) base/diff (higher is better)
/DEBUG:full 126.8 71.9 1.76
/DEBUG:fastlink 30.3 21.5 1.41
Input size (bytes) 5,858,077,238 5,442,644,550 1.08


Google Chrome (x86 debug build)
Link time (seconds) VS 2017 15.9 Update (base) VS 2019 Preview 2 (diff) base/diff (higher is better)
/DEBUG:full 232.6 106.9 2.18
/DEBUG:fastlink 43.8 38.8 1.13
Input size (bytes) 8,384,258,922 7,962,819,862 1.05


We don’t see as large a linker input size reduction when building Chrome as when building AAA game title, because the compilation for Chrome is using /Zi, for which the compiler writes types into PDB file, while the compilation of AAA game title is using /Z7, for which type records are written into .debug$T sections in OBJs and unreferenced ones will be pruned away. We would also see that full PDB link time tends to benefit more from the improvements than fastlink PDB link time. This is because fastlink PDB generation doesn’t involve type merging and creation of global symbols, and therefore the latter two improvements don’t apply. Type pruning done by the compiler benefits both kinds of linking by reducing raw amount of work on debug records that the linker has to do to produce PDB.

Closing Remarks

We know build throughput is important for developers and we are continuing to improve our toolset’s performance. For next few releases we will be working on reducing compiler throughput cost on pruning unreferenced types as well as continuous improvement on various PDB internal hashes. If you have feedback or suggestions for us, let us know. We can be reached via comments below, via email (visualcpp@microsoft.com), or you can provide feedback via Help -> Report a Problem in the Product in Visual Studio IDE, or via Developer Community. You can also find us on Twitter (@VisualC) and Facebook (msftvisualcpp).


The post Linker Throughput Improvement in Visual Studio 2019 appeared first on C++ Team Blog.

Viewing all 1541 articles
Browse latest View live


<script src="https://jsc.adskeeper.com/r/s/rssing.com.1596347.js" async> </script>