The January 2019 update of the Visual Studio Code C++ extension is now available. This release includes many new features and bug fixes including documentation comments support, improved #include autocomplete performance, better member function completion, and many IntelliSense bug fixes. For a full list of this release’s improvements, check out our release notes on Github.
Documentation Comments
We added support for documentation comments for hover, completion, and signature help. You can now see documentation comments in tooltips. Let’s look at a simple box_sample.cpp program that defines a “Box” object with various dimensions.
The comment associated with a class or member function is shown in a tooltip when you hover over a place where the class or member function is used. For example, we can see the “Box object” comment in our main function where we create a Box instance:
#include Autocomplete
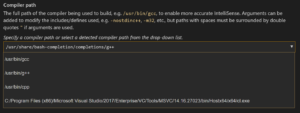
This update improves #include autocomplete performance. It now shows individual folders instead of entire paths, thus fixing previous performance issues. When you autocomplete the #include recommendation. In the example below, we modified our original box_sample.cpp program where we place the Box object definition in a separate header file within the “Objects” folder. Now, when we go into our main box_sample.cpp file and see our #include auto-complete suggestion, we see the “Objects” folder auto-complete recommendation.
Improved Member Function Completion
With improved member function completion, the selected completion is committed after a parenthesis “(“ is entered. This removes the need to accept an autocompletion (using tab, enter, or click) and type the parenthesis. You will now receive the suggested text along with parentheses and the cursor in the middle for a simpler editing experience. Here’s a look at how this works with the “volume” member function for our Box object:
This also works for class and member function templates after you type a “<” completion character.
Note that if you accept the autocompletion using tab, enter, or click, we do not currently auto-add the parenthesis.
IntelliSense Bug Fixes
As per customer feedback, we’re continuing to work on bug fixes for IntelliSense. This release we’ve made some IntelliSense fixes including error squiggle improvements, process crash fixes, and increased stability.
You can see additional details of the issues we fixed in our release notes on GitHub.
Tell Us What You Think
Download the C/C++ extension for Visual Studio Code, give it a try, and let us know what you think. If you run into any issues, or have any suggestions, please report them on the Issues section of our GitHub repository. Join our Insiders program to get early builds of our extension.
Please also take our quick survey to help us shape this extension to meet your needs. We can be reached via the comments below or via email (visualcpp@microsoft.com). You can also find us on Twitter (@VisualC).
Visual Studio 2019 pushes the boundaries of individual and team productivity. We hope that you will find these new capabilities compelling and start your upgrade to Visual Studio 2019 soon.
As you are considering this upgrade, rest assured that Visual Studio 2019 makes it distinctively easy to move your codebase from previous versions of Visual Studio. This post captures the reasons why your upgrade to Visual Studio 2019 will be pain-free.
You can install the latest version of Visual Studio on a computer that already has an earlier version installed and continue to use both versions in parallel with no interference. This is a great way to try Visual Studio 2019 or adopt it for some of your projects. The Visual Studio Installer will let you manage installations of Visual Studio 2017 and 2019 from a central UI.
MSVC v140 (VS 2015.3) and MSVC v141 (VS 2017) Toolsets in the Visual Studio 2019 IDE
Even if you are not ready yet to move your project to the latest toolset (MSVC v142), you can still load your project in the Visual Studio 2019 IDE and continue to use your current older toolset.
Loading your existing C++ projects into the IDE will not upgrade/change your project files. This way, your projects also load in the previous version of the IDE in case you need to go back or you have teammates that have not yet upgraded to VS 2019 (this functionality is also known as project round-tripping).
Toolsets from older VS installations on your box are visible as platform toolsets in the latest IDE. And if you are starting fresh with only VS 2019 installed on your machine, it is very easy to acquire these older toolsets directly from the Visual Studio Installer by customizing the C++ Desktop workload (with the Individual Components tab listing all the options).
New v142 toolset now available
Within the Visual Studio 2019 wave (previews, its general availability, and future updates), we plan to continue evolving our C++ compilers and libraries with
new C++20 features,
faster build throughput, and
even better codegen optimizations.
The MSVC v142 toolset is now available and it already brings severalincentives for you to migrate.
VC Runtime in the latest MSVC v142 toolset is binary compatible with v140 and v141
We heard it loud and clear that a major reason contributing to MSVC v141’s fast adoption today is its binary compatibility with MSVC v140. This allowed you to migrate your own code to the v141 toolset at your own pace, without having to wait for any of your 3rd party library dependencies to migrate first.
We want to keep the momentum going and make sure that you have a similarly successful adoption experience with MSVC v142 too. This is why we’re announcing today that our team is committed to provide binary compatibility for MSVC v142 with both MSVC v141 and v140.
This means that if you compile all your code with the v142 toolset but still have one or more libraries that are built with the v140 or v141 toolset, linking all of it together (with the latest linker) will work as expected. To make this possible, VC Runtime does not change its major version in VS 2019 and remains backward compatible with previous VC Runtime versions.
When you mix binaries built with different supported versions of the MSVC toolset, there is a version requirement for the VCRedist that you redistribute with your app. Specifically, the VCRedist can’t be older than any of the toolset versions used to build your app.
Hundreds of C++ libraries on Vcpkg are available regardless of the toolset you’re using
If you are using Vcpkg today with VS 2015 or VS 2017 for one or more of your open-source dependencies, you will be happy to learn that these libraries (close to 900 at the time of this writing) can now be compiled with the MSVC v142 toolset and are available for consumption in Visual Studio 2019 projects.
Because v142 is binary compatible with v141 and v140, all the packages you’ve already installed will also continue to work in VS 2019 without recompilation; however, we do recommend recompiling when you can so that you can enjoy the new compiler optimizations we’ve added to v142!
If you have VS 2019 Preview installed side-by-side with an older version of VS (e.g. VS 2017), Vcpkg will prefer the stable release, so you will need to set Vcpkg’s triplet variable VCPKG_PLATFORM_TOOLSET to v142 to use the latest MSVC toolset.
MSVC compiler version changes to 19.2x (from 19.1x in MSVC v141)
Last but not least, the compiler part of the MSVC v142 toolset changes its version to 19.20 – only a minor version increment compared with MSVC v141.
Note that feature-test macros are supported in the MSVC compiler and STL starting with MSVC v141 and they should be the preferred option to enable your code to support multiple MSVC versions.
Call to action
Please download Visual Studio 2019 today and let us know what you think. Our goal is to make your transition to VS 2019 as easy as possible so, as always, we are very interested in your feedback. We can be reached via the comments below or via email (visualcpp@microsoft.com).
If you encounter other problems with Visual Studio or MSVC or have a suggestion please let us know through Help > Send Feedback > Report A Problem / Provide a Suggestion in the product, or via Developer Community. You can also find us on Twitter at @VisualC.
We have made a bunch of improvements to Visual Studio’s CMake support in the latest preview of the IDE. Many of these changes are taking the first steps to close the gap between working with solutions generated by CMake and the IDE’s native support. Please try out the preview and let us know what you think.
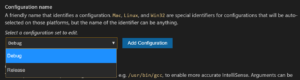
One of the first things you might notice when you open your CMake projects in Visual Studio 2019 Preview 2 is that the CMake menu has disappeared. Don’t worry, nothing is wrong. We just reorganized these items into the existing Project, Build, Debug, and Test menus. For instance, the Project menu now looks like this:
The CMake settings and cache control entries have been moved from the CMake menu to the project menu. Items related to Build, Debug, and Test have been moved accordingly. We hope this reorganization is more intuitive to new users and users who have been using Visual Studio for a long time.
CMake Settings Editor
We received a lot of feedback about the CMakeSettings.json since we first shipped CMake support in Visual Studio. To simplify configuring CMake projects, we have added a graphical editor for CMake Settings.
You can learn more about the editor here. We would love to hear your feedback about what works well and what doesn’t for your projects. Please try it out and let us know.
Vcpkg Integration
If you have installed vcpkg, CMake projects opened in Visual Studio will automatically integrate the vcpkg toolchain file. This means you don’t have to do any additional configuration to use vcpkg with your CMake projects. This support works for both local vcpkg installations and vcpkg installations on remote machines that you are targeting. This behavior is disabled automatically when you specify any other toolchain in your CMake Settings configuration.
If you are interested in learning more about vcpkg and CMake, stay tuned. A more detailed post about using vcpkg with CMake is coming to the blog soon.
Easier CMake Toolchain Customization
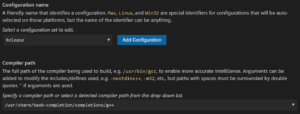
If you use custom CMake toolchain files, configuring your projects just got a little bit easier. Previously, you had to manually specify CMake toolchain files with the “cmakeArgs” parameter in CMakeSettings.json. Now, instead of adding “-DCMAKE_TOOLCHAIN_FILE=…” to the command line you can simply add a “cmakeToolchain” parameter to your configuration in CMake Settings.
The IDE will warn you if you attempt to specify more than one toolchain file.
Automatic Installation of CMake on Linux Targets
Visual Studio’s Linux support for CMake projects requires a recent version of CMake to be installed on the target machine. Often, the version offered by a distribution’s default package manager is not recent enough to support all the IDE’s features. Previously, the only way to work around this was to build CMake from source or install more recent pre-built binaries manually. This was especially painful for users who targeted many Linux machines.
The latest preview of Visual Studio can automatically install a user local copy of CMake on remote Linux machines that don’t have a recent (or any) version of CMake installed. If a compatible version of CMake isn’t detected the first time you build your project, you will see an info-bar asking if you want to install CMake. With one click you will be ready to build and debug on the remote machine.
Support for Just My Code
Visual Studio 2019 Preview 2 also adds Just My Code support for CMake projects. If you are building for Windows using the MSVC compiler your CMake projects will now enable Just my Code support in the compiler and linker automatically.
To debug with Just my Code, make sure the feature is enabled in Tools > Options > Debugging > General.
For now, you will need to use the version of CMake that ships with Visual Studio to get this functionality. This feature will be available for all installations of CMake in an upcoming version. If you need to suppress this behavior for any reason you can modify your CMakeLists to remove the “/JMC” flag from “CMAKE_CXX_FLAGS”.
Warnings for Misconfigured CMake Settings
A common source of user feedback and confusion has been the results of choosing incompatible settings for a CMake project’s configuration in CMakeSettings.json. For instance:
Using a 32-bit generator with a 64-bit configuration.
Using the wrong kind of verbosity syntax in “buildCommandArgs” for the chosen generator.
These misconfigurations are now called out explicitly by the IDE instead of causing CMake configuration failures that can often be difficult to diagnose.
Better Build Feedback and CMake Configure Verbosity
CMake project build and configuration progress is now better integrated into the IDE’s UI. You will see build progress in the status bar when using the Ninja and MSBuild generators.
You also now have more control over the verbosity of messages from CMake during configure. By default, most messages will be suppressed unless there is an error. You can see all messages by enabling this feature in Tools > Options > CMake.
Send Us Feedback
Your feedback is a critical part of ensuring that we can deliver the best CMake experience. We would love to know how Visual Studio 2019 Preview is working for you. If you have any feedback specific to CMake Tools, please reach out to cmake@microsoft.com. For general issues please Report a Problem.
This post builds on using multi-stage containers for C++ development. That post showed how to use a single Dockerfile to describe a build stage and a deployment stage resulting in a container optimized for deployment. It did not show you how to use a containers with your development environment. Here we will show how to use those containers with VS Code. The source for this article is the same as that of the previous article: the findfaces GitHub repo.
Creating a container for use with VS Code
VS Code has the capability to target a remote system for debugging. Couple that with a custom build task for compiling in your container and you will have an interactive containerized C++ development environment.
We’ll need to change our container definition a bit to enable using it with VS Code. These instructions are based on some base container definitions that David Ducatel has provided in this GitHub repo. What we’re doing here is taking those techniques and applying them to our own container definition. Let’s look at another Dockerfile for use with VS Code, Dockerfile.vs.
FROM findfaces/build

LABEL description="Container for use with VS"

RUN apk update && apk add --no-cache \
    gdb openssh rsync zip

RUN echo 'PermitRootLogin yes' >> /etc/ssh/sshd_config && \
    echo 'PermitEmptyPasswords yes' >> /etc/ssh/sshd_config && \
    echo 'PasswordAuthentication yes' >> /etc/ssh/sshd_config && \
    ssh-keygen -A

EXPOSE 22
CMD ["/usr/sbin/sshd", "-D"]
In the FROM statement we’re basing this definition on the local image we created earlier in our multi-stage build. That container already has all our basic development prerequisites, but for VS Code usage we need a few more things enumerated above. Notably, we need SSH for communication with VS Code for debugging which is configured in the RUN command. As we are enabling root login, this container definition is not appropriate for anything other than local development. The entry point for this container is SSH specified in the CMD line. Building this container is simple.
docker build -t findfaces/vs -f Dockerfile.vs .
We need to specify a bit more to run a container based on this image so VS Code can debug processes in it.
One of the new parameters we haven’t covered before is –security-opt. As debugging requires running privileged operations, we’re running the container in unconfined mode. The other new parameter we’re using is -v, which creates a bind mount that maps our local file system into the container. This is so that when we edit files on our host those changes are available in the container without having to rebuild the image or copy them into the running container. If you look at Docker’s documentation, you’ll find that volumes are usually preferred over bind mounts today. However, sharing source code with a container is considered a good use of a bind mount. Note that our build container copied our src directory to /src. Therefore in this container definition we will use interactively we are mapping our local src directory to /source so it doesn’t conflict with what is already present in the build container.
Building C++ in a container with VS Code
First, let’s configure our build task. This task has already been created in tasks.json under the .vscode folder in the repo we’re using with this post. To configure it in a new project, press Ctrl+Shift+B and follow the prompts until you get to “other”. Our configured build task appears as follows.
The “label” value tells VS Code this is our build task and the type that we’re running a command in the shell. The command here is ssh (which is available on Windows 10). The arguments are passing the parameters to ssh to login to the container with the correct port and run a script. The content of that script reads as follows.
cd /source/output && \
cmake .. -DCMAKE_BUILD_TYPE=Debug -DCMAKE_TOOLCHAIN_FILE=/tmp/vcpkg/scripts/buildsystems/vcpkg.cmake -DVCPKG_TARGET_TRIPLET=x64-linux-musl && \
make
You can see that this script just invokes CMake in our output directory, then builds our project. The trick is that we are invoking this via ssh in our container. After this is set up, you can run a build at any time from within VS Code, as long as your container is running.
Debugging C++ in a container with VS Code
To bring up the Debug view click the Debug icon in the Activity Bar. Tasks.json has already been created in the .vscode folder of the repo for this post. To create one in a new project, select the configure icon and follow the prompts to choose any configuration. The configuration we need is not one of the default options, so once you have your tasks.json select Add Configuration and choose C/C++: (gdb) Pipe Launch. The Pipe Launch configuration starts a tunnel, usually SSH, to connect to a remote machine and pipe debug commands through.
You’ll want to modify the following options in the generated Pipe Launch configuration.
The above parameters in the configuration specify the program to launch on the remote system, any arguments, whether to stop at entry, and what the current working directory on the remote is. The next block shows how to start the pipe.
You’ll note here that “pipeProgram” is not just “ssh”, the full path to the executable is required. The path in the example above is the full path to ssh on Windows, it will be different on other systems. The pipe arguments are just the parameters to pass to ssh to start the remote connection. The debugger path option is the default and is correct for this example.
We need to add one new parameter at the end of the configuration.
This option tells the debugger to map /source on the remote to our local path so that our sources our properly found.
Hit F5 to start debugging in the container. The provided launch.json is configured to break on entry so you can immediately see it is working.
IntelliSense for C++ with a container
There are a couple of ways you can setup IntelliSense for use with your C++ code intended for use in a container. Throughout this series of posts we have been using vcpkg to get our libraries. If you use vcpkg on your host system, and have acquired the same libraries using it, then your IntelliSense should work for your libraries.
System headers are another thing. If you are working on Mac or Linux perhaps they are close enough that you are not concerned with configuring this. If you are on Windows, or you want your IntelliSense to exactly match your target system, you will need to get your headers onto your local machine. While your container is running, you can use scp to accomplish this (which is available on Windows 10). Create a directory where you want to save your headers, navigate there in your shell, and run the following command.
scp -r -P 12345 root@localhost:/usr/include .
To get the remote vcpkg headers you can similarly do the following.
When you are done with your development simply stop the container.
docker stop findfacesvscode
The next time you need it spin it back up.
docker start findfacesvscode
And of course, you need to rerun your multi-stage build to populate your runtime container with your changes.
docker build -t findfaces/run .
Remember that in this example we have our output configured under our source directory on the host. That directory will be copied into the build container if you don’t delete it (which you don’t want), so delete the output directory contents before rebuilding your containers (or adjust your scripts to avoid this issue).
What next
We plan to continue our exploration of containers in future posts. Looking forward, we will introduce a helper container that provides a proxy for our service and to deploy our containers to Azure. We will also revisit this application using Windows containers in the future.
Give us feedback
We’d love to hear from you about what you’d like to see covered in the future about containers. We’re excited to see more people in the C++ community start producing their own content about using C++ with containers. Despite the huge potential for C++ in the cloud with containers, there is very little material out there today.
If you could spare a few minutes to take our C++ cloud and container development survey, it will help us focus on topics that are important to you on the blog and in the form of product improvements.
Visual Studio 2019 Preview 2 was a huge release for us, so we’ve written a host of articles to explore the changes in more detail. For the short version, see the Visual Studio 2019 Preview 2 Release Notes.
We’d love for you to download Visual Studio 2019 Preview, give it a try, and let us know how it’s working for you in the comments below or via email (visualcpp@microsoft.com). If you encounter problems or have a suggestion, please let us know through Help > Send Feedback > Report A Problem / Provide a Suggestion or via Visual Studio Developer Community. You can also find us on Twitter @VisualC.
In the latest Preview release of Visual Studio 2019 version 16.1, we’ve added two quick fixes to the Code Analysis experience focused around uninitialized variable checks.These quick fixes are available via the Quick Actions (lightbulb) menu on relevant lines, accessed by hovering over the line or squiggle, or by pressing Ctrl+Period.
The first release of Visual Studio 2019 brought in-editor code analysis and various C++ productivity improvements, including a quick fix for the NULL to nullptr rule and others. In implementing further code analysisquick fixes, we are basing decisions on the following criteria: 1) the warning should have a low false positive rate; 2) the warning should be high-impact and have a potentially significantdownside if not corrected; 3) the warning should have a relatively simple fix. Looking at the most feasible warnings, Preview 3 provides quick fixes for the following:
C6001: using uninitialized memory <variable>
Visual Studio reports warning C6001when an uninitialized local variable is used before being assigned a value, which can lead to unpredictable results.This warning may be fixed by adding empty curly braces so that the variable/object is value-initialized (will be all zeros).
This warning and corresponding quick fix are enabled by default in the Microsoft Native Minimum ruleset.
C26494: VAR_USE_BEFORE_INIT
Thiswarning goes hand-in-hand with the previous one and is fixed in the same way. However, while warningC6001 is generated where the uninitialized variable is used, warning C26494shows up where the variable is declared.
Note that this warning and corresponding quick fix are not enabled in the default ruleset, but rather under the C++ Core Check Type Rules.To change rulesets in anMSBuild project, navigate to Property Pages > Code Analysis > General; for projects using CMake, add the "codeAnalysisRuleset" key into your CMakeSettings.json with the value set to the full path or the filename of a ruleset file.
Send us feedback
Thank you to everyone who helps make Visual Studio a better experience for all. Your feedback is critical in ensuring we can deliver the best Code Analysis experience. We’d love for you to download Visual Studio 2019 16.1 Preview 3, give it a try, and let us know how it’s working for you in the comments below or via email. If you encounter problems or have suggestions, please Report A Problem, or let us know via Visual Studio Developer Community. You can also find us on Twitter @VisualC.
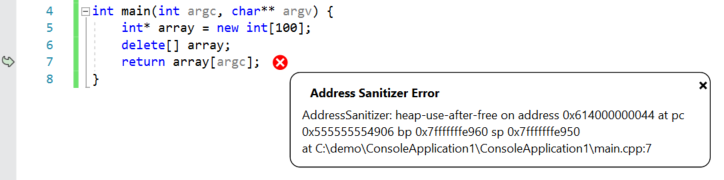
ASan detects errors that are encountered during program execution and stops execution on the first detected error. When you run a program that has ASan enabled under the debugger, you will see the following error message (detailing the type of error and location) at the line where the error occurred:
You can also view the full ASan output (including where the corrupted memory was allocated/deallocated) in the Debug pane of the output window.
Getting started with ASan in Visual Studio
In order to use ASan in Visual Studio, you need to install the debug symbols for ASan (libasan-dbg) on your remote Linux machine or WSL installation. The version of libasan-dbg that you load depends on the version of GCC you have installed on your Linux machine:
ASan version
GCC version
libasan0
gcc-4.8
libasan2
gcc-5
libasan3
gcc-6
libasan4
gcc-7
libasan5
gcc-8
You can determine the version of GCC you have on your Linux machine or WSL installation with the following command:
gcc --version
You can also view the version of libasan-dbg you will need by looking at the Debug pane of the output window. The version of ASan that is loaded corresponds to the version of libasan-dbg you will need on your Linux machine. You can search for the following line (ctrl + F) in the Debug pane of the output window:
In this example, my Linux machine (Ubuntu 18.04) is using libasan4.
You can install the ASan debug bits on Linux distros that use apt with the following command (this command installs version 4):
sudo apt-get install libasan4-dbg
If you have enabled ASan in Visual Studio, then we will prompt you to install the debug symbols for ASan at the top of the Debug pane of the output window.
Enable ASan for MSBuild-based Linux projects
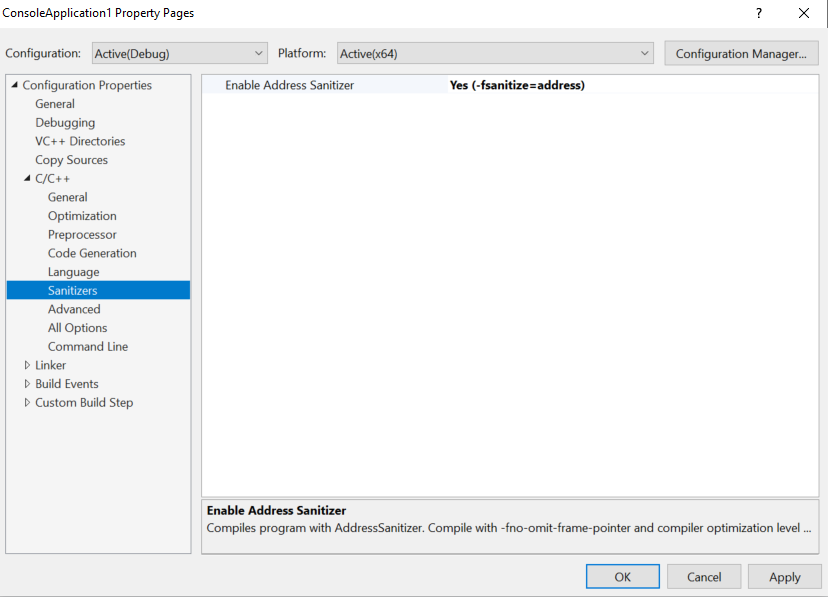
You can enable ASan for MSBuild-based Linux projects in the project’s Property Pages. Right-click on the project in the Solution Explorer and select “Properties” to open the project’s Property Pages, then navigate to Configuration Properties > C/C++ > Sanitizers. ASan is enabled via compiler and linker flags and requires recompilation in order to work.
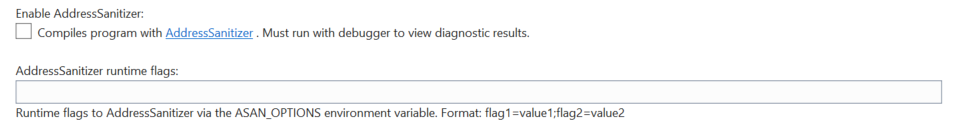
You can also pass optional ASan runtime flags by navigating to Configuration Properties > Debugging > AddressSanitizer Runtime Flags.
Enable ASan for Visual Studio CMake projects
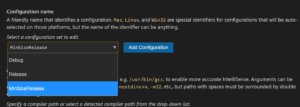
You can enable ASan for CMake configurations targeting a remote Linux machine or WSL in the CMake Settings Editor. In the “General” section of the editor you will see the following two properties to enable ASan and pass optional runtime flags:
Again, ASan is enabled via compiler and linker flags and requires recompilation in order to work.
Give us your feedback!
If you have feedback on ASan for the Linux Workload or anything regarding our Linux support in Visual Studio, we would love to hear from you. We can be reached via the comments below or via email (visualcpp@microsoft.com). If you encounter other problems with Visual Studio or MSVC or have a suggestion, you can use the Report a Problem tool in Visual Studio or head over to Visual Studio Developer Community. You can also find us on Twitter (@VisualC) and (@erikasweet_).
Native support for the Windows Subsystem for Linux (WSL)
Visual Studio now provides native support for using C++ with WSL. WSL lets you run a lightweight Linux environment directly on Windows, including most command-line tools, utilities, and applications. In Visual Studio you no longer need to add a remote connection or configure SSH in order to build and debug on your local WSL installation. Check out our post on native support for WSL in Visual Studio to learn more and follow a step-by-step guide on getting started.
Separate build and debug targets for Linux projects
You can now separate your remote build machine from your remote debug machine for both MSBuild-based Linux projects and CMake projects that target a remote Linux machine. For example, you can now cross-compile on x64 and deploy to an ARM device when targeting IoT scenarios.
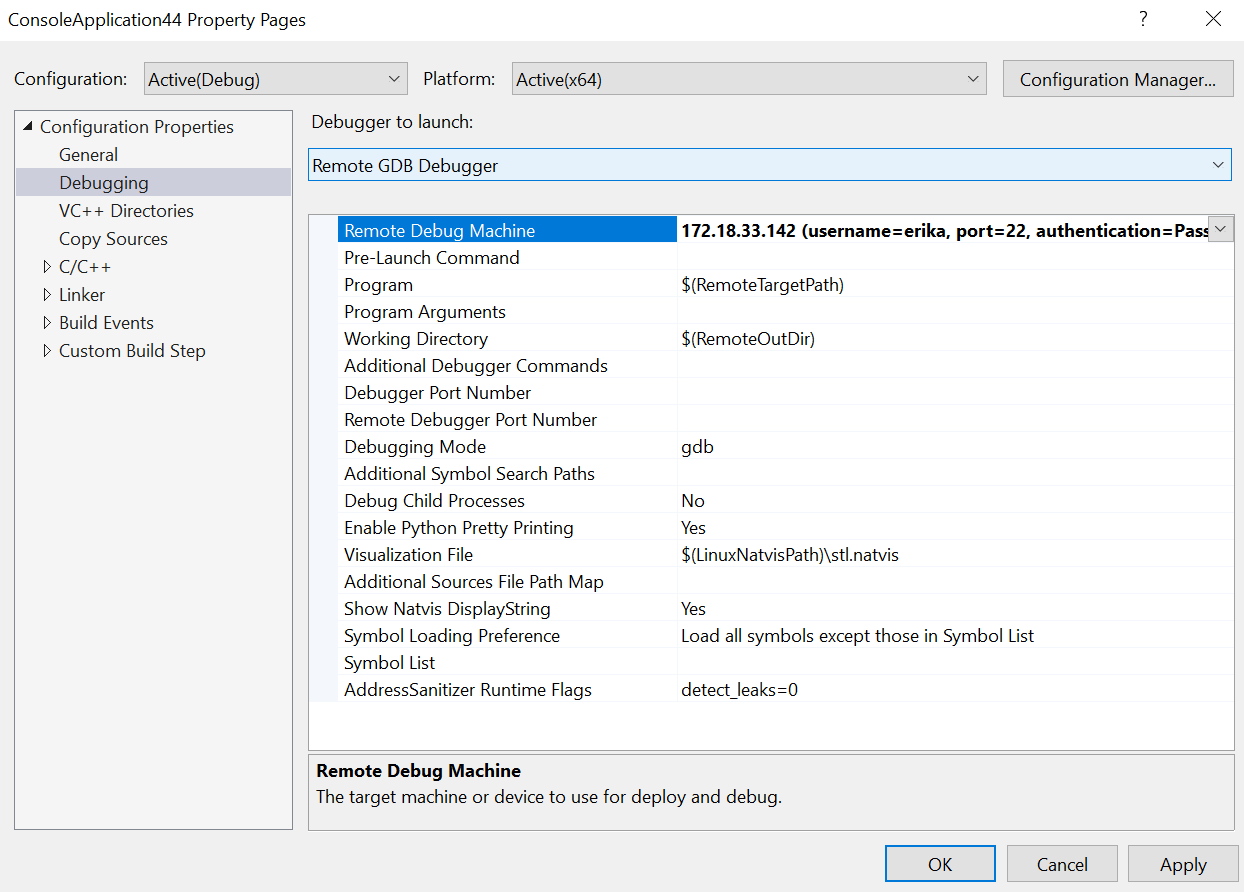
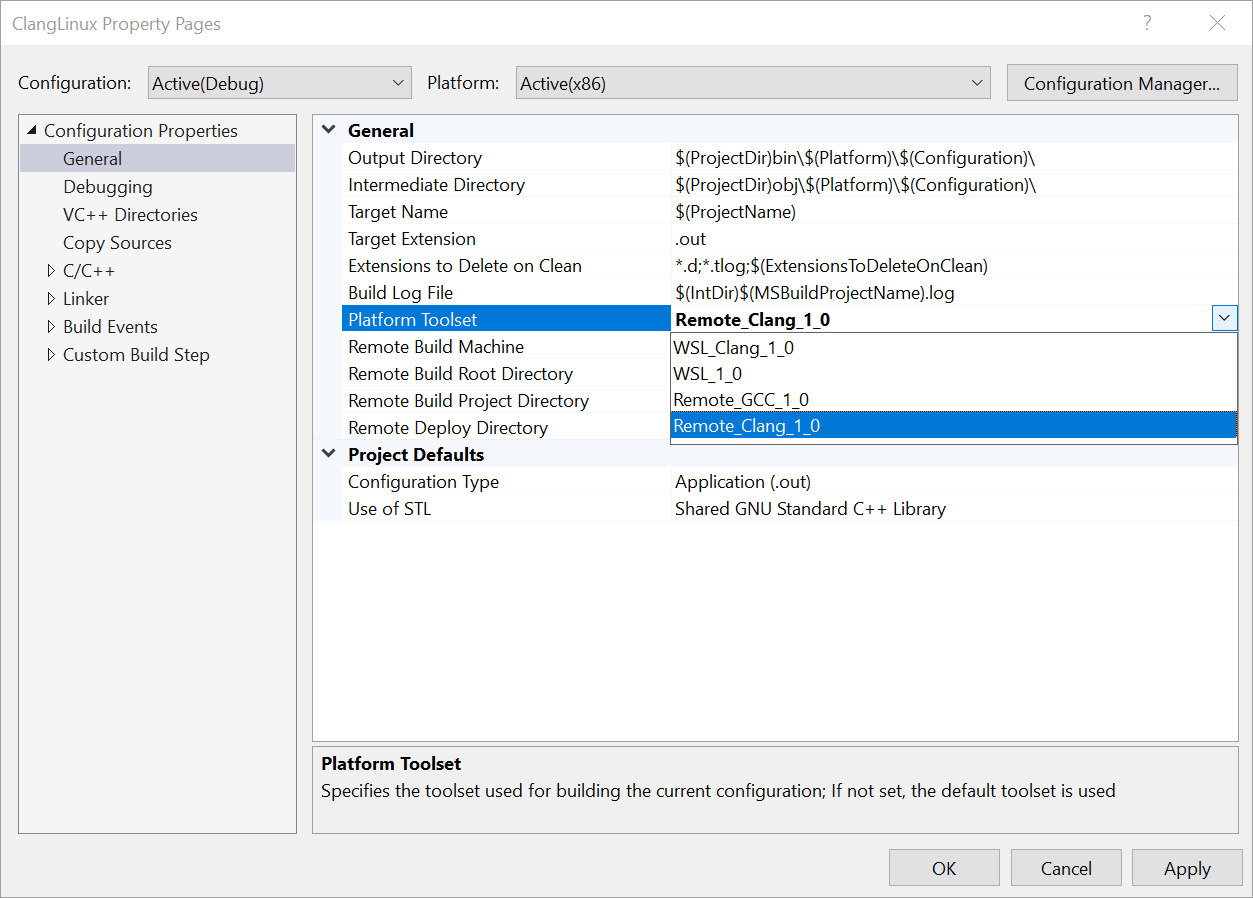
For a MSBuild-based Linux project, you can specify a new remote debug machine in the project’s Property Pages (Configuration Properties > Debugging > Remote Debug Machine). By default, this value is synchronized with your remote build machine (Configuration Properties > General > Remote Build Machine).
The drop-down menu is populated with all established remote connections. To add a new remote connection, navigate to Tools > Options > Cross Platform > Connection Manager or search for “Connection Manager” in the search bar at the top of your screen. You can also specify a new remote deploy directory in the project’s Property Pages (Configuration Properties > General > Remote Deploy Directory).
By default, only the files necessary for the process to debug will be deployed to the remote debug machine. You can view/configure which source files will be deployed via the Solution Explorer. When you click on a source file, you will see a preview of its File Properties directly below the Solution Explorer. You can also right-click on a source file and select “Properties.”
The “Content” property specifies whether the file will be deployed to the remote debug machine. You can also disable deployment entirely by navigating to Property Pages > Configuration Manager and unchecking “Deploy” for the desired configuration.
If you want complete control over your project’s deployment (e.g. some files you want to deploy are outside of your solution or you want to customize your remote deploy directory per file/directory), then you can append the following code block(s) to your .vcxproj file:
<ItemGroup>
   <RemoteDeploy Include="__example.cpp">
<!-- This is the source Linux machine, can be empty if DeploymentType is LocalRemote -->
      <SourceMachine>$(RemoteTarget)</SourceMachine>
      <TargetMachine>$(RemoteDebuggingTarget)</TargetMachine>
      <SourcePath>~/example.cpp</SourcePath>
      <TargetPath>~/example.cpp</TargetPath>
<!-- DeploymentType can be LocalRemote, in which case SourceMachine will be empty and SourcePath is a local file on Windows -->
      <DeploymentType>RemoteRemote</DeploymentType>
<!-- Indicates whether the deployment contains executables -->
      <Executable>true</Executable>
   </RemoteDeploy>
</ItemGroup>
For CMake projects that target a remote Linux machine, you can specify a new remote debug machine via launch.vs.json. By default, the value of “remoteMachineName” will be synchronized with the “remoteMachineName” property in CMakeSettings.json, which corresponds to your remote build machine. These properties no longer need to match, and the value of “remoteMachineName” in launch.vs.json will dictate the remote machine used for deploy and debug.
IntelliSense will suggest all a list of all established remote connections, but you can add a new remote connection by navigating to Tools > Options > Cross Platform > Connection Manager or searching for “Connection Manager” in the search bar at the top of your screen.
If you want complete control over your deployment, you can append the following code block(s) to launch.vs.json:
The best way to report a problem or suggest a feature to the C++ team is via Developer Community. The following feedback tickets related to C++ cross-platform development have been recently resolved in Visual Studio 2019 16.1 Preview 2 or Preview 3:
Do you have feedback on our Linux tooling in Visual Studio? Pick a time to chat with the C++ cross-platform team and share your experiences – the good and the bad – to help us prioritize and build the right features for you! We can also be reached via the comments below, email (visualcpp@microsoft.com), and Twitter (@VisualC) and (@erikasweet_).
There’s seeing your build, and then there’s REALLY seeing your build. The difference can be quite dramatic, unveiling a new world of possibilities. As part of a partnership between IncrediBuild and Visual Studio, you can enjoy these possibilities directly within Visual Studio.
We previously discussed IncrediBuild, a software acceleration technology that speeds up your builds, tests, and other development process times. While IncrediBuild’s solution is known mainly for its impressive development acceleration capabilities, there’s another, very interesting capability to take note of: IncrediBuild’s Build Monitor tool. This elegant build visualization tool replaces your old text output with a sleek, intuitive graphic UI, transforming your build into a visual entity you can easily engage with, and helps you spot long durations, errors, warnings, bottlenecks, and dependencies.
Let’s take a look at the standard text output we’re all used to working with:
Now take a look at how a build looks like with IncrediBuild’s Build Monitor tool, seamlessly integrated into the Visual Studio experience (see additional information about invoking IncrediBuild’s Build Monitor from within Visual Studio at the bottom of the post):
Each color represents the build task status, allowing you to immediately identify which build tasks were executed without a problem and which require your attention. The bar width represents the duration of a specific task, and the side navigation bar lays out the specific machine and core on which the task was executed.
However, that’s not all there is to it. This tool also includes:
Customization capabilities – the build top graph is customizable, enabling you to keep track of relevant performance indicators such as CPU usage, tasks ready to be executed, memory usage, I/O, and much more.
Replay – You can replay your build process to examine how it performed and share it with team
Gaps detection – You can improve your build quality by quickly detecting tasks with long durations, errors, warnings, bottlenecks, unneeded dependencies, gaps, and more.
Display types – You can switch between display types:
Progress display – This is the colorful display discussed above
Output display – Allows you to see the entire build’s output text, similar to what would have been generated by Visual Studio. Double-clicking a task from the progress display will jump directly to the task’s textual output.
Projects display – Allows you to distinguish between each project’s/configuration’s standard output, along with a status bar representing the project’s build status.
Summary display -Presents an overview of all the build information, including the total build time.
IncrediBuild’s Build Monitor tool comes hand in hand with IncrediBuild’s main benefit: its ability to highly accelerate C++ builds by enabling you to use the idle CPU cycles of other machines in your network, effectively transforming each local machine or build server into a virtual super computer with dozens of cores. We’ve discussed IncrediBuild’s effect on build times while building on even a single development machine in a previous blog post. However, to realize IncrediBuild’s full potential, and take advantage of its entire acceleration capabilities, it is recommended to deploy it on more machines and cores. Simply connect your colleagues’ IncrediBuild Agents with yours and each of you will be able to seamlessly use the aggregated idle CPU power of all the machines connected together.
Visual Studio 2019 allows you to leverage these capabilities free of charge (for your local machine) and get a real speed boost on your software development.
How to install IncrediBuild from the Visual Studio Installer
Once you have downloaded the Visual Studio 2019 installer, IncrediBuild is presented as an optional component for C++ workloads.
After checking the IncrediBuild checkbox your Visual Studio installation will come with an Incredibuild submenu under the “Extensions” menu.
How to invoke the Build Monitor display (as well as IncrediBuild acceleration capabilities) from within Visual Studio 2019
After installing IncrediBuild within Visual Studio, you’ll have the Build Monitor display available to you upon initiating a build using IncrediBuild.
To initiate a build using IncrediBuild, just navigate to the ‘Extensions’ menu and choose one of the build options (Build Solution /Rebuild Solution/ Clean Solution). If you already initiated a build via IncrediBuild, and want to view the current build on the Build Monitor, simply navigate to the ‘View’ menu and choose ‘IncrediBuild Monitor’.
Talk To Us
We encourage you to download Visual Studio 2019 and try the IncrediBuild functionality. We can be reached via the comments below or via email (visualcpp@microsoft.com). If you encounter other problems with Visual Studio or have other suggestions you can use the Report a Problem tool in Visual Studio or head over to the Visual Studio Developer Community. You can also find us on Twitter (@VisualC).
The Quick Info tooltip has received a couple of improvements in Visual Studio 2019 version 16.1 Preview 3.
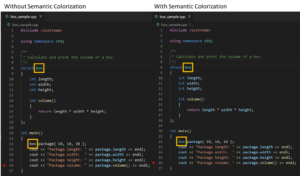
Quick Info Colorization
While Quick Info was previously all black text, the tooltip now respects the semantic colorization of your editor:
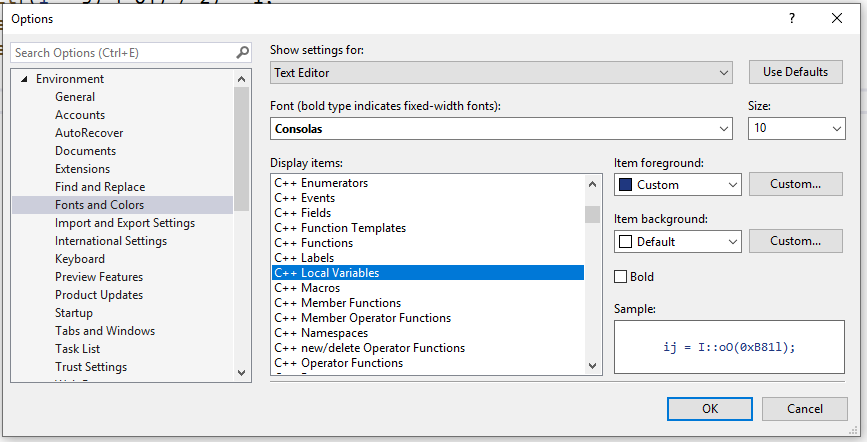
If you’d like to customize your semantic colorization, you can do that by searching “font” in the Visual Studio Search box (Ctrl + Q), or by navigating to Tools > Options > Environment > Fonts and Colors:
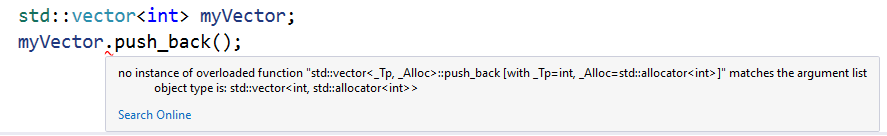
Quick Info Search Online
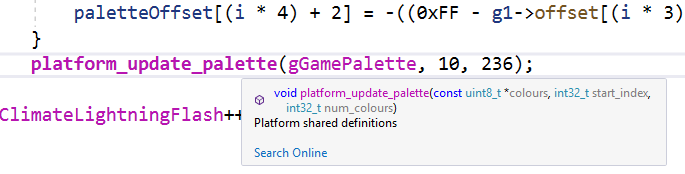
The Quick Info tooltip has a new “Search Online” link that will search for online docs to learn more about the hovered code construct. For red-squiggled code, the link provided by Quick Info will search for the error online. This way you don’t need to retype the message into your browser.
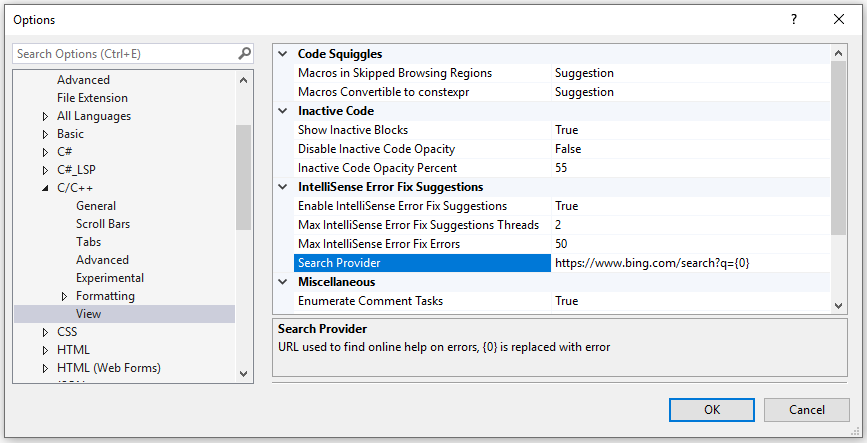
You can customize your Search Provider under Tools > Options > Text Editor > C++ > View.
Talk to Us!
If you have feedback on Quick Info in Visual Studio, we would love to hear from you. We can be reached via the comments below or via email (visualcpp@microsoft.com). If you encounter other problems with Visual Studio or MSVC or have a suggestion, you can use the Report a Problem tool in Visual Studio or head over to Visual Studio Developer Community. You can also find us on Twitter (@VisualC) and (@nickuhlenhuth).
In Visual Studio 2019 version 16.1 we have updated the version of CMake we ship inbox to CMake 3.14. This comes with performance improvements for extracting generated build system information. Additionally, we now support virtually all the Visual Studio capabilities regardless of the CMake binary origin so long as the CMake version is at least 3.14. The main reason for this is the introduction of the file-based API, which we now support, and which provides a new way for retrieving semantic information. This is now the recommended way to connect an IDE to CMake, the old CMake server being deprecated, and we are an early adopter of the feature.
Visual Studio Performance Improvements
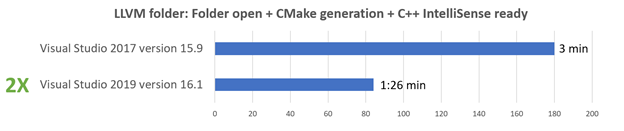
The indexing is now significantly faster for code opened via Open folder, and as a result IntelliSense is available considerably faster than in Visual Studio 2017. As an example, in the LLVM codebase, IntelliSense becomes available at least 2 times faster in Visual Studio 2019. Additionally, a new indexing algorithm lights up IntelliSense incrementally while the folder is being indexed.
In Visual Studio 2017 on average it takes 3 min from the point of opening the LLVM folder, to the point where you have IntelliSense, including generation. In Visual Studio 2019 it takes 1:26 min, including generation.
CMake 3.14
We now ship CMake 3.14 in-box with Visual Studio. This contains the new file-based API, and support for the Visual Studio 2019 generators. To see the full set of changes, please see the CMake 3.14 release notes.
Visual Studio 2019 Generators
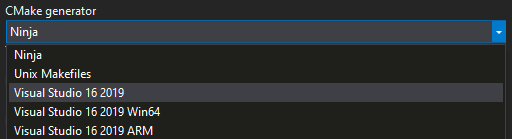
CMake 3.14 introduces support for the Visual Studio 2019 generators. The new generator is called “Visual Studio 16 2019”, and the platform targeting is simplified. To use a specific platform, use the -A argument. For example, to use the Visual Studio 2019 generator targeting the x64 platform: cmake.exe -G “Visual Studio 16 2019” -A x64
File-based API
The file-based API allows a client to write query files prior to build system generation. During build system generation CMake will read those query files and write object model response files. Prior to this API’s introduction we were using the cmake-server to get the equivalent information. We‘re still supporting the old model, but starting with 3.14 we can now support the new model as well. One of the differences in our CMake fork on github was the backtrace information needed for our Targets View feature inside Visual Studio. Prior to CMake 3.14 we needed the CMake version from our fork, in order for Targets View to work properly. Now, with the file-based API this is no longer required.
The file-based API provides a simpler, standard path to the future, with official support in CMake itself. We expect most users to see either performance improvements or not notice any degradation of performance. Extracting the information to populate the Visual Studio UI is faster because we are just reading the response files rather than running CMake in long-running server mode, there is less memory usage and less overhead associated with creating and maintaining processes.
These value-added features light up automatically when you update to Visual Studio 2019 version 16.1 Preview 2.
Send Us Feedback
Your feedback is a critical part of ensuring that we can deliver the best CMake experience. We would love to know how Visual Studio 2019 version 16.1 is working for you. If you have any questions specific to CMake Tools, please reach out to cmake@microsoft.com or leave a comment. If you find any issues or have a suggestion, the best way to reach out to us is to Report a Problem.
Writing good documentation is hard. Tools can’t solve this problem in themselves, but they can ease the pain. This post will show you how to use Sphinx to generate attractive, functional documentation for C++ libraries, supplied with information from Doxygen. We’ll also integrate this process into a CMake build system so that we have a unified workflow.
For an example of a real-world project whose documentation is built like this, see fmtlib.
Why Sphinx?
Doxygen has been around for a couple of decades and is a stable, feature-rich tool for generating documentation. However, it is not without its issues. Docs generated with Doxygen tend to be visually noisy, have a style out of the early nineties, and struggle to clearly represent complex template-based APIs. There are also limitations to its markup. Although they added Markdown support in 2012, Markdown is simply not the best tool for writing technical documentation since it sacrifices extensibility, featureset size, and semantic markup for simplicity.
Sphinx instead uses reStructuredText, which has those important concepts which are missing from Markdown as core ideals. One can add their own “roles” and “directives” to the markup to make domain-specific customizations. There are some great comparisons of reStructuredText and Markdown by Victor Zverovich and Eli Bendersky if you’d like some more information.
The docs generated by Sphinx also look a lot more modern and minimal when compared to Doxygen and it’s much easier to swap in a different theme, customize the amount of information which is displayed, and modify the layout of the pages.
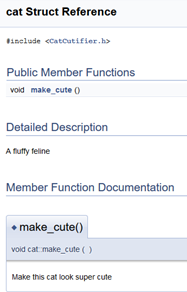
Doxygen output
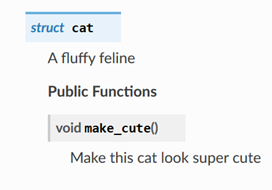
Sphinx output
On a more fundamental level, Doxygen’s style of documentation is listing out all the API entities along with their associated comments in a more digestible, searchable manner. It’s essentially paraphrasing the header files, to take a phrase from Robert Ramey[1]; embedding things like rationale, examples, notes, or swapping out auto-generated output for hand-written is not very well supported. In Sphinx however, the finer-grained control gives you the ability to write documentation which is truly geared towards getting people to learn and understand your library.
If you’re convinced that this is a good avenue to explore, then we can begin by installing dependencies.
Install Dependencies
Doxygen
Sphinx doesn’t have the ability to extract API documentation from C++ headers; this needs to be supplied either by hand or from some external tool. We can use Doxygen to do this job for us. Grab it from the official download page and install it. There are binaries for Windows, Linux (compiled on Ubuntu 16.04), and MacOS, alongside source which you can build yourself.
Sphinx
Pick your preferred way of installing Sphinx from the official instructions. It may be available through your system package manager, or you can get it through pip.
Read the Docs Sphinx Theme
I prefer this theme to the built-in ones, so we can install it through pip:
> pip install sphinx_rtd_theme
Breathe
Breathe is the bridge between Doxygen and Sphinx; taking the output from the former and making it available through some special directives in the latter. You can install it with pip:
#pragma once

/**
  A fluffy feline
*/
struct cat {
  /**
    Make this cat look super cute
  */
  void make_cute();
};
CatCutifier/CatCutifier/CMakeLists.txt
add_library (CatCutifier "CatCutifier.cpp" "CatCutifier.h")

target_include_directories(CatCutifier PUBLIC .)
If you now build your project, you should get a CatCutifier library which someone could link against and use.
Now that we have our library, we can set up document generation.
Set up Doxygen
If you don’t already have Doxygen set up for your project, you’ll need to generate a configuration file so that it knows how to generate docs for your interfaces. Make sure the Doxygen executable is on your path and run:
> mkdir docs
> cd docs
> doxygen.exe -g
You should get a message like:
Configuration file `Doxyfile' created.
Now edit the configuration file and enter
  doxygen Doxyfile
to generate the documentation for your project
We can get something generated quickly by finding the INPUT variable in the generated Doxyfile and pointing it at our code:
INPUT = ../CatCutifier
Now if you run:
> doxygen.exe
You should get an html folder generated which you can point your browser at and see some documentation like this:
We’ve successfully generated some simple documentation for our class by hand. But we don’t want to manually run this command every time we want to rebuild the docs; this should be handled by CMake.
Doxygen in CMake
To use Doxygen from CMake, we need to find the executable. Fortunately CMake provides a find module for Doxygen, so we can use find_package(Doxygen REQUIRED) to locate the binary and report an error if it doesn’t exist. This will store the executable location in the DOXYGEN_EXECUTABLE variable, so we can add_custom_command to run it and track dependencies properly:
find_package(Doxygen REQUIRED)

# Find all the public headers
get_target_property(CAT_CUTIFIER_PUBLIC_HEADER_DIR CatCutifier INTERFACE_INCLUDE_DIRECTORIES)
file(GLOB_RECURSE CAT_CUTIFIER_PUBLIC_HEADERS ${CAT_CUTIFIER_PUBLIC_HEADER_DIR}/*.h)

#This will be the main output of our command
set(DOXYGEN_INDEX_FILE ${CMAKE_CURRENT_SOURCE_DIR}/html/index.html)

add_custom_command(OUTPUT ${DOXYGEN_INDEX_FILE}
                   DEPENDS ${CAT_CUTIFIER_PUBLIC_HEADERS}
                   COMMAND ${DOXYGEN_EXECUTABLE} Doxyfile
                   WORKING_DIRECTORY ${CMAKE_CURRENT_SOURCE_DIR}
                   MAIN_DEPENDENCY Doxyfile
                   COMMENT "Generating docs")

add_custom_target(Doxygen ALL DEPENDS ${DOXYGEN_INDEX_FILE})
The final custom target makes sure that we have a target name to give to make and that dependencies will be checked for a rebuild whenever we Build All or do a bare make.
We also want to be able to control the input and output directories from CMake so that we’re not flooding our source directory with output files. We can do this by adding some placeholders to our Doxyfile (we’ll rename it Doxyfile.in to follow convention) and having CMake fill them in with configure_file:
find_package(Doxygen REQUIRED)

# Find all the public headers
get_target_property(CAT_CUTIFIER_PUBLIC_HEADER_DIR CatCutifier INTERFACE_INCLUDE_DIRECTORIES)
file(GLOB_RECURSE CAT_CUTIFIER_PUBLIC_HEADERS ${CAT_CUTIFIER_PUBLIC_HEADER_DIR}/*.h)

set(DOXYGEN_INPUT_DIR ${PROJECT_SOURCE_DIR}/CatCutifier)
set(DOXYGEN_OUTPUT_DIR ${CMAKE_CURRENT_BINARY_DIR}/docs/doxygen)
set(DOXYGEN_INDEX_FILE ${DOXYGEN_OUTPUT_DIR}/html/index.html)
set(DOXYFILE_IN ${CMAKE_CURRENT_SOURCE_DIR}/Doxyfile.in)
set(DOXYFILE_OUT ${CMAKE_CURRENT_BINARY_DIR}/Doxyfile)

#Replace variables inside @@ with the current values
configure_file(${DOXYFILE_IN} ${DOXYFILE_OUT} @ONLY)

file(MAKE_DIRECTORY ${DOXYGEN_OUTPUT_DIR}) #Doxygen won't create this for us
add_custom_command(OUTPUT ${DOXYGEN_INDEX_FILE}
                   DEPENDS ${CAT_CUTIFIER_PUBLIC_HEADERS}
                   COMMAND ${DOXYGEN_EXECUTABLE} ${DOXYFILE_OUT}
                   MAIN_DEPENDENCY ${DOXYFILE_OUT} ${DOXYFILE_IN}
                   COMMENT "Generating docs")

add_custom_target(Doxygen ALL DEPENDS ${DOXYGEN_INDEX_FILE})
Now we can generate our documentation as part of our build system and it’ll only be generated when it needs to be. If you’re happy with Doxygen’s output, you could just stop here, but if you want the additional features and attractive output which reStructuredText and Sphinx give you, then read on.
Setting up Sphinx
Sphinx provides a nice startup script to get us going fast. Go ahead and run this:
> cd docs
> sphinx-quickstart.exe
Keep the defaults and put in your name and the name of your project. Now if you run make html you should get a _build/html folder you can point your browser at to see a welcome screen.
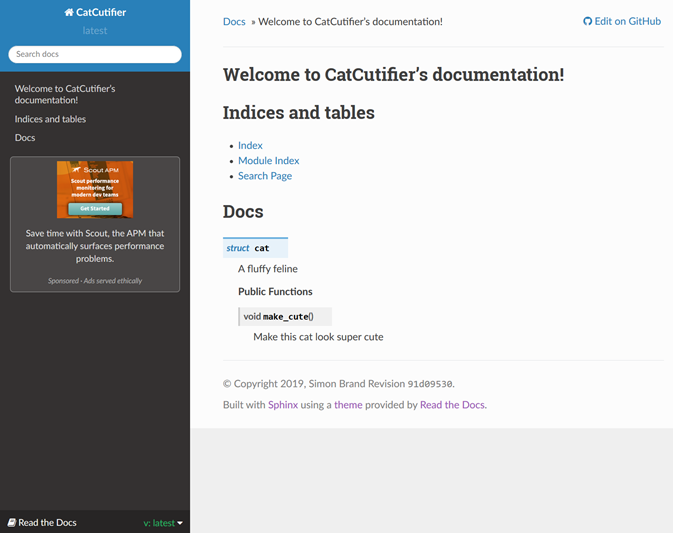
I’m a fan of the Read the Docs theme we installed at the start, so we can use that instead by changing html_theme in conf.py to be ‘sphinx_rtd_theme’. That gives us this look:
Before we link in the Doxygen output to give us the documentation we desire, lets automate the Sphinx build with CMake
Sphinx in CMake
Ideally we want to be able to write find_package(Sphinx REQUIRED) and have everything work. Unfortunately, unlike Doxygen, Sphinx doesn’t have a find module provided by default, so we’ll need to write one. Fortunately, we can get away with doing very little work:
CatCutifier/cmake/FindSphinx.cmake
#Look for an executable called sphinx-build
find_program(SPHINX_EXECUTABLE
             NAMES sphinx-build
             DOC "Path to sphinx-build executable")

include(FindPackageHandleStandardArgs)

#Handle standard arguments to find_package like REQUIRED and QUIET
find_package_handle_standard_args(Sphinx
                                  "Failed to find sphinx-build executable"
                                  SPHINX_EXECUTABLE)
With this file in place, find_package will work so long as we tell CMake to look for find modules in that directory:
CatCutifier/CMakeLists.txt
cmake_minimum_required (VERSION 3.8)

project ("CatCutifier")

# Add the cmake folder so the FindSphinx module is found
set(CMAKE_MODULE_PATH "${PROJECT_SOURCE_DIR}/cmake" ${CMAKE_MODULE_PATH})

add_subdirectory ("CatCutifier")
add_subdirectory ("docs")
Now we can find this executable and call it:
CatCutifier/docs/CMakeLists.txt
find_package(Sphinx REQUIRED)

set(SPHINX_SOURCE ${CMAKE_CURRENT_SOURCE_DIR})
set(SPHINX_BUILD ${CMAKE_CURRENT_BINARY_DIR}/docs/sphinx)

add_custom_target(Sphinx ALL
                  COMMAND
                  ${SPHINX_EXECUTABLE} -b html
                  ${SPHINX_SOURCE} ${SPHINX_BUILD}
                  WORKING_DIRECTORY ${CMAKE_CURRENT_BINARY_DIR}
                  COMMENT "Generating documentation with Sphinx")
If you run a build you should now see Sphinx running and generating the same blank docs we saw earlier.
Now we have the basics set up, we need to hook Sphinx up with the information generated by Doxygen. We do that using Breathe.
Setting up Breathe
Breathe is an extension to Sphinx, so we set it up using the conf.py which was generated for us in the last step:
You might wonder why it’s necessary to explicitly state what entities we wish to document and where, but this is one of the key benefits of Sphinx. This allows us to add as much additional information (examples, rationale, notes, etc.) as we want to the documentation without having to shoehorn it into the source code, plus we can make sure it’s displayed in the most accessible, understandable manner we can. Have a look through Breathe’s directives and Sphinx’s built-in directives, and Sphinx’s C++-specific directives to get a feel for what’s available.
Now we update our Sphinx target to hook it all together by telling Breathe where to find the Doxygen output:
CatCutifier/docs/CMakeLists.txt
#...

find_package(Sphinx REQUIRED)

set(SPHINX_SOURCE ${CMAKE_CURRENT_SOURCE_DIR})
set(SPHINX_BUILD ${CMAKE_CURRENT_BINARY_DIR}/docs/sphinx)

add_custom_target(Sphinx ALL
                  COMMAND ${SPHINX_EXECUTABLE} -b html
                  # Tell Breathe where to find the Doxygen output
                  -Dbreathe_projects.CatCutifier=${DOXYGEN_OUTPUT_DIR}
                  ${SPHINX_SOURCE} ${SPHINX_BUILD}
                  WORKING_DIRECTORY ${CMAKE_CURRENT_BINARY_DIR}
                  COMMENT "Generating documentation with Sphinx")
Hooray! You should now have some nice Sphinx documentation generated for you:
Finally, we can make sure all of our dependencies are right so that we never rebuild the Doxygen files or the Sphinx docs when we don’t need to:
CatCutifier/docs/CMakeLists.txt
find_package(Doxygen REQUIRED)
find_package(Sphinx REQUIRED)

# Find all the public headers
get_target_property(CAT_CUTIFIER_PUBLIC_HEADER_DIR CatCutifier INTERFACE_INCLUDE_DIRECTORIES)
file(GLOB_RECURSE CAT_CUTIFIER_PUBLIC_HEADERS ${CAT_CUTIFIER_PUBLIC_HEADER_DIR}/*.h)

set(DOXYGEN_INPUT_DIR ${PROJECT_SOURCE_DIR}/CatCutifier)
set(DOXYGEN_OUTPUT_DIR ${CMAKE_CURRENT_BINARY_DIR}/doxygen)
set(DOXYGEN_INDEX_FILE ${DOXYGEN_OUTPUT_DIR}/xml/index.xml)
set(DOXYFILE_IN ${CMAKE_CURRENT_SOURCE_DIR}/Doxyfile.in)
set(DOXYFILE_OUT ${CMAKE_CURRENT_BINARY_DIR}/Doxyfile)

# Replace variables inside @@ with the current values
configure_file(${DOXYFILE_IN} ${DOXYFILE_OUT} @ONLY)

# Doxygen won't create this for us
file(MAKE_DIRECTORY ${DOXYGEN_OUTPUT_DIR})

# Only regenerate Doxygen when the Doxyfile or public headers change
add_custom_command(OUTPUT ${DOXYGEN_INDEX_FILE}
                   DEPENDS ${CAT_CUTIFIER_PUBLIC_HEADERS}
                   COMMAND ${DOXYGEN_EXECUTABLE} ${DOXYFILE_OUT}
                   MAIN_DEPENDENCY ${DOXYFILE_OUT} ${DOXYFILE_IN}
                   COMMENT "Generating docs"
                   VERBATIM)

# Nice named target so we can run the job easily
add_custom_target(Doxygen ALL DEPENDS ${DOXYGEN_INDEX_FILE})

set(SPHINX_SOURCE ${CMAKE_CURRENT_SOURCE_DIR})
set(SPHINX_BUILD ${CMAKE_CURRENT_BINARY_DIR}/sphinx)
set(SPHINX_INDEX_FILE ${SPHINX_BUILD}/index.html)

# Only regenerate Sphinx when:
# - Doxygen has rerun
# - Our doc files have been updated
# - The Sphinx config has been updated
add_custom_command(OUTPUT ${SPHINX_INDEX_FILE}
                   COMMAND
                     ${SPHINX_EXECUTABLE} -b html
                     # Tell Breathe where to find the Doxygen output
                     -Dbreathe_projects.CatCutifier=${DOXYGEN_OUTPUT_DIR}/xml
                   ${SPHINX_SOURCE} ${SPHINX_BUILD}
                   WORKING_DIRECTORY ${CMAKE_CURRENT_BINARY_DIR}
                   DEPENDS
                   # Other docs files you want to track should go here (or in some variable)
                   ${CMAKE_CURRENT_SOURCE_DIR}/index.rst
                   ${DOXYGEN_INDEX_FILE}
                   MAIN_DEPENDENCY ${SPHINX_SOURCE}/conf.py
                   COMMENT "Generating documentation with Sphinx")

# Nice named target so we can run the job easily
add_custom_target(Sphinx ALL DEPENDS ${SPHINX_INDEX_FILE})

# Add an install target to install the docs
include(GNUInstallDirs)
install(DIRECTORY ${SPHINX_BUILD}
DESTINATION ${CMAKE_INSTALL_DOCDIR})
Try it out and see what gets rebuilt when you change a file. If you change Doxyfile.in or a header file, all the docs should get rebuilt, but if you only change the Sphinx config or reStructuredText files then the Doxygen build should get skipped.
This leaves us with an efficient, automated, powerful documentation system.
If you already have somewhere to host the docs or want developers to build the docs themselves then we’re finished. If not, you can host them on Read the Docs, which provides free hosting for open source projects.
Setting up Read the Docs
To use Read the Docs (RtD) you need to sign up (you can use GitHub, GitLab or Bitbucket to make integration easy). Log in, import your repository, and your docs will begin to build!
Unfortunately, it will also fail:
Traceback (most recent call last): File "/home/docs/checkouts/readthedocs.org/user_builds/cpp-documentation-example/envs/latest/lib/python3.7/site-packages/sphinx/registry.py", line 472, in load_extension mod = __import__(extname, None, None, ['setup']) ModuleNotFoundError: No module named 'breathe'
To tell RtD to install Breathe before building, we can add a requirements file:
CatCutifier/docs/requirements.txt
breathe
Another issue is that RtD doesn’t understand CMake: it’s finding the Sphinx config file and running that, so it won’t generate the Doxygen information. To generate this, we can add some lines to our conf.py script to check if we’re running in on the RtD servers and, if so, hardcode some paths and run Doxygen:
CatCutifier/docs/conf.py
import subprocess, os

def configureDoxyfile(input_dir, output_dir):
    with open('Doxyfile.in', 'r') as file :
        filedata = file.read()

    filedata = filedata.replace('@DOXYGEN_INPUT_DIR@', input_dir)
    filedata = filedata.replace('@DOXYGEN_OUTPUT_DIR@', output_dir)

    with open('Doxyfile', 'w') as file:
        file.write(filedata)

# Check if we're running on Read the Docs' servers
read_the_docs_build = os.environ.get('READTHEDOCS', None) == 'True'

breathe_projects = {}

if read_the_docs_build:
    input_dir = '../CatCutifier'
    output_dir = 'build'
    configureDoxyfile(input_dir, output_dir)
    subprocess.call('doxygen', shell=True)
    breathe_projects['CatCutifier'] = output_dir + '/xml'

# ...
Push this change and…
Lovely documentation built automatically on every commit.
Conclusion
All this tooling takes a fair amount of effort to set up, but the result is powerful, expressive, and accessible. None of this is a substitute for clear writing and a strong grasp of what information a user of a library needs to use it effectively, but our new system can provide support to make this easier for developers.
Resources
Thank you to the authors and presenters of these resources, which were very helpful in putting together this post and process:
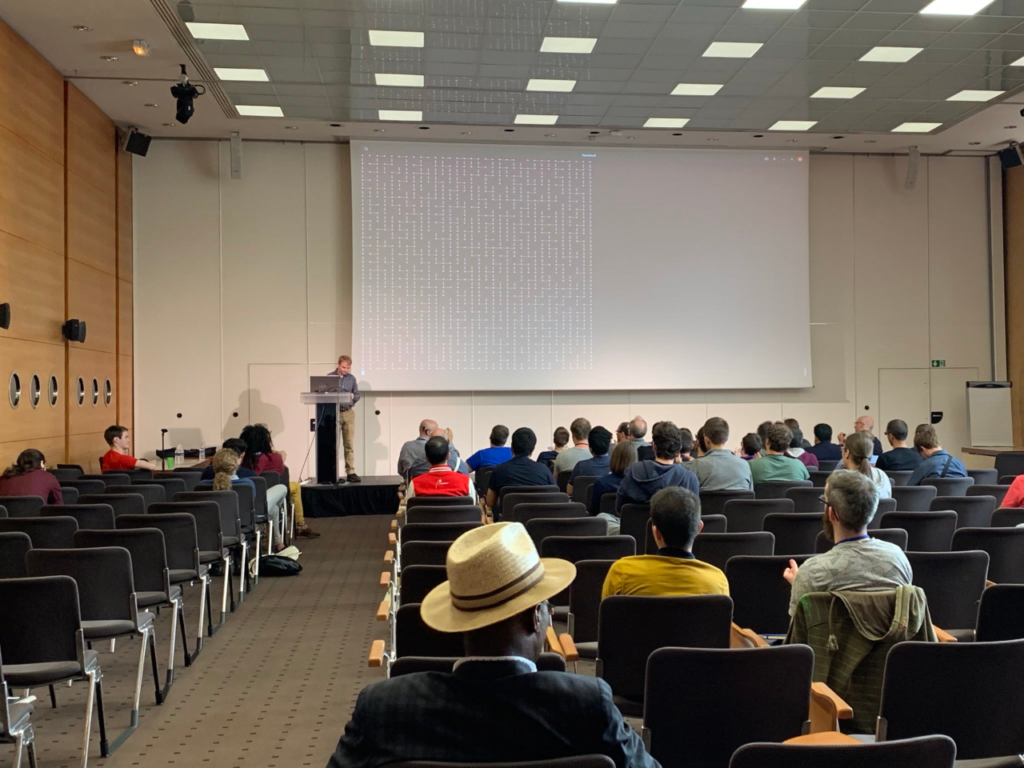
CPPP is a new C++ conference in Paris, France. Its first iteration ran for a single day with three parallel tracks, drawing in 160 attendees.
The conference great on all fronts: the speakers & talks were varied and high-quality, the venue was right next to the Eiffel Tower and had plenty of space, the food was tasty and varied (shoutout to the cream filled pastries), and the day went smoothly with strong communication from the organisers (Joel Falcou and Fred Tingaud).
The three tracks were themed on roughly beginner, intermediate, and expert content, where the beginner track was in French and the other two were in English.
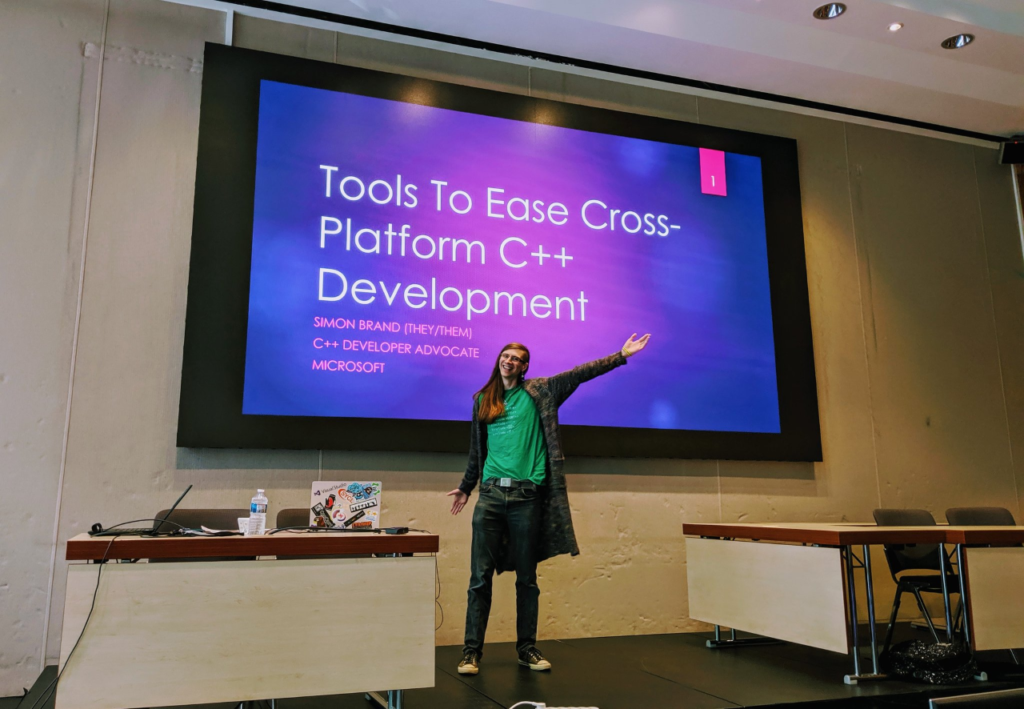
My talk was named “Tools to Ease Cross-Platform C++ Development”. I tried something a bit different from other cross-platform talks we’ve given, in that I tried to develop a cross-platform application live rather than demoing different features one-by-one.
I wrote a whole Brainfuck-to-x64 compiler in Visual Studio during the talk which targeted Windows and Linux (through the WSL configuration in VS) and used Vcpkg to fulfill a dependency on fmtlib. The compiler worked first time as well! You can find the code and slides on GitHub.
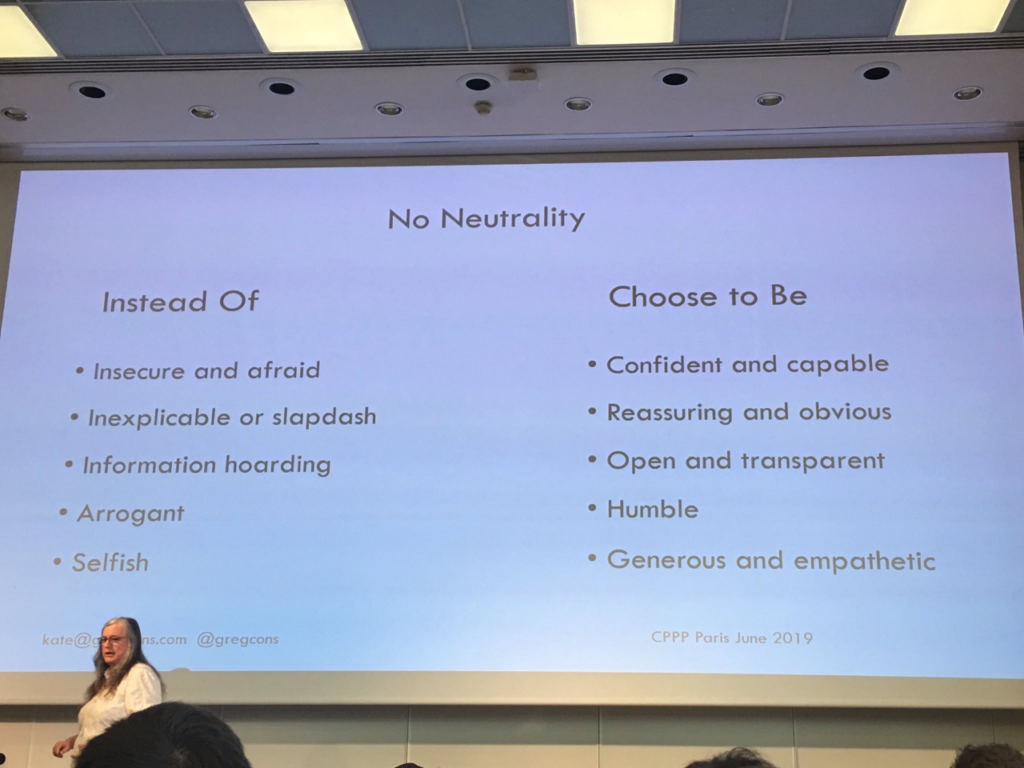
After some pastries and an introduction from the organisers, we began with a keynote from Kate Gregory on Emotional Code. This was the third time I’d seen a version of this talk live (once at C++ on Sea and again at ACCUConf), but it was still very enjoyable this time round and had some new content to make it worthwhile.
As programmers, we can be under the belief that code is neutral and emotionless, but Kate argues that this is not the case, and that the code you write can reflect a lot about the environment in which you work. I find this talk illuminating each time I watch it, I’d recommend giving it a try and thinking about how your work situation can be improved to make your code better. Kate is also one of those speakers who I could watch talk about her teapot collection (I don’t know if she has a teapot collection) and not get bored, so if nothing else you’ll have a good way to pass an hour.
Mock Interviews
I gave my talk after Kate’s, after which I napped on a couch to recover somewhat before helping out with the mock interviews. I and some other experienced interviewers had a series of 20 min talks with people looking to improve their interview skills. This session wasn’t very well attended, but I think those who came found it very valuable. Having run a similar event at CppCon, I think these are wonderful opportunities for people to get in some practice before trying to get jobs, so I’d highly recommend looking out for them when you’re at an event.
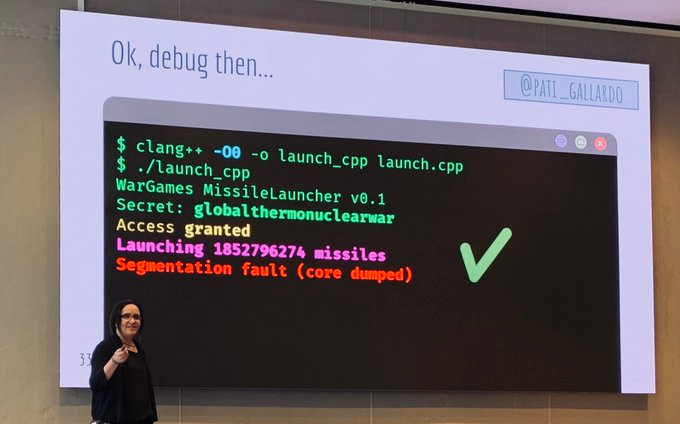
Patricia’s talks are always energetic and engaging, with beautiful slides and keen insights. This one was no different, even if I was exhausted by this point of the day and got told off for nodding off in the front row (sorry Patricia!).
This was an introduction into how code exploits work by breaking the program out of the world of normal behaviour and into the upside-down of The Weird, then how execution is controlled in this bizarre state. It’s is a great first step into the technical details of software vulnerabilities, so give it a watch if you’re interested in learning about this area.
Ben Deane – Identifying Monoids: Exploiting Compositional Structure in Code
I was particularly interested in seeing this talk, since it’s essentially a one-hour answer to a question I asked Ben in one of his CppCon 2018 talks. I wasn’t disappointed.
The core of Ben’s presentation was that identifying monoids (a set along with a binary operation which is closed and associative, e.g. the set of integers under integer addition) in your types allows you to:
Expose the underlying structures in your code
Exploit these structures to make your types and operations more clear and composable
He took a very practical code-based approach, so the talk is very accessible for people who have found some of the mathematical underpinnings which he’s talking about difficult to understand.
Next Year
Next year it will run for two days and I expect a stronger turnout due to the success of its first run. I’d highly recommend going along and hope to see you there!
This post is part of a regular series of posts where the C++ product team here at Microsoft and other guests answer questions we have received from customers. The questions can be about anything C++ related: MSVC toolset, the standard language and library, the C++ standards committee, isocpp.org, CppCon, etc. Today’s post is by Cameron DaCamara.
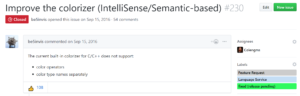
C++20 adds a new operator, affectionately dubbed the “spaceship” operator: <=>. There was a post awhile back by our very own Simon Brand detailing some information regarding this new operator along with some conceptual information about what it is and does. The goal of this post is to explore some concrete applications of this strange new operator and its associated counterpart, the operator== (yes it has been changed, for the better!), all while providing some guidelines for its use in everyday code.
Comparisons
It is not an uncommon thing to see code like the following:
Note: eagle-eyed readers will notice this is actually even less verbose than it should be in pre-C++20 code because these functions should actually all be nonmember friends, more about that later.
That is a lot of boilerplate code to write just to make sure that my type is comparable to something of the same type. Well, OK, we deal with it for awhile. Then comes someone who writes this:
constexpr bool is_lt(const IntWrapper& a, const IntWrapper& b) {
  return a < b;
}
int main() {
  static_assert(is_lt(0, 1));
}
The first thing you will notice is that this program will not compile.
error C3615: constexpr function 'is_lt' cannot result in a constant expression
Ah! The problem is that we forgot constexpr on our comparison function, drat! So one goes and adds constexpr to all of the comparison operators. A few days later someone goes and adds a is_gt helper but notices all of the comparison operators do not have an exception specification and goes through the same tedious process of adding noexcept to each of the 5 overloads.
This is where C++20’s new spaceship operator steps in to help us out. Let’s see how the original IntWrapper can be written in a C++20 world:
#include <compare>
struct IntWrapper {
  int value;
  constexpr IntWrapper(int value): value{value} { }
  auto operator<=>(const IntWrapper&) const = default;
};
The first difference you may notice is the new inclusion of <compare>. The <compare> header is responsible for populating the compiler with all of the comparison category types necessary for the spaceship operator to return a type appropriate for our defaulted function. In the snippet above, the return type auto will be deduced to std::strong_ordering.
Not only did we remove 5 superfluous lines, but we don’t even have to define anything, the compiler does it for us! Our is_lt remains unchanged and just works while still being constexpr even though we didn’t explicitly specify that in our defaulted operator<=>. That’s well and good but some people may be scratching their heads as to whyis_lt is allowed to still compile even though it does not even use the spaceship operator at all. Let’s explore the answer to this question.
Rewriting Expressions
In C++20, the compiler is introduced to a new concept referred to “rewritten” expressions. The spaceship operator, along with operator==, are among the first two candidates subject to rewritten expressions. For a more concrete example of expression rewriting, let us break down the example provided in is_lt.
During overload resolution the compiler is going to select from a set of viable candidates, all of which match the operator we are looking for. The candidate gathering process is changed very slightly for the case of relational and equivalency operations where the compiler must also gather special rewritten and synthesized candidates ([over.match.oper]/3.4).
For our expression a < b the standard states that we can search the type of a for an operator<=> or a namespace scope function operator<=> which accepts its type. So the compiler does and it finds that, in fact, a‘s type does contain IntWrapper::operator<=>. The compiler is then allowed to use that operator and rewrite the expression a < b as (a <=> b) < 0. That rewritten expression is then used as a candidate for normal overload resolution.
You may find yourself asking why this rewritten expression is valid and correct. The correctness of the expression actually stems from the semantics the spaceship operator provides. The <=> is a three-way comparison which implies that you get not just a binary result, but an ordering (in most cases) and if you have an ordering you can express that ordering in terms of any relational operations. A quick example, the expression 4 <=> 5 in C++20 will give you back the result std::strong_ordering::less. The std::strong_ordering::less result implies that 4 is not only different from 5 but it is strictly less than that value, this makes applying the operation (4 <=> 5) < 0 correct and exactly accurate to describe our result.
Using the information above the compiler can take any generalized relational operator (i.e. <, >, etc.) and rewrite it in terms of the spaceship operator. In the standard the rewritten expression is often referred to as (a <=> b) @ 0 where the @ represents any relational operation.
Synthesizing Expressions
Readers may have noticed the subtle mention of “synthesized” expressions above and they play a part in this operator rewriting process as well. Consider a different predicate function:
If we use our original definition for IntWrapper this code will not compile.
error C2677: binary '<': no global operator found which takes type 'const IntWrapper' (or there is no acceptable conversion)
This makes sense in pre-C++20 land, and the way to solve this problem would be to add some extra friend functions to IntWrapper which take a left-hand side of int. If you try to build that sample with a C++20 compiler and our C++20 definition of IntWrapper you might notice that it, again, “just works”—another head scratcher. Let’s examine why the code above is still allowed to compile in C++20.
During overload resolution the compiler will also gather what the standard refers to as “synthesized” candidates, or a rewritten expression with the order of the parameters reversed. In the example above the compiler will try to use the rewritten expression (42 <=> a) < 0 but it will find that there is no conversion from IntWrapper to int to satisfy the left-hand side so that rewritten expression is dropped. The compiler also conjures up the “synthesized” expression 0 < (a <=> 42) and finds that there is a conversion from int to IntWrapper through its converting constructor so this candidate is used.
The goal of the synthesized expressions are to avoid the mess of needing to write the boilerplate of friend functions to fill in gaps where your object could be converted from other types. Synthesized expressions are generalized to 0 @ (b <=> a).
More Complex Types
The compiler-generated spaceship operator doesn’t stop at single members of classes, it will generate a correct set of comparisons for all of the sub-objects within your types:
The compiler knows how to expand members of classes that are arrays into their lists of sub-objects and compare them recursively. Of course, if you wanted to write the bodies of these functions yourself you still get the benefit of the compiler rewriting expressions for you.
Looks Like a Duck, Swims Like a Duck, and Quacks Like operator==
Some very smart people on the standardization committee noticed that the spaceship operator will always perform a lexicographic comparison of elements no matter what. Unconditionally performing lexicographic comparisons can lead to inefficient generated code with the equality operator in particular.
The canonical example is comparing two strings. If you have the string "foobar" and you compare it to the string "foo" using == one would expect that operation to be nearly constant. The efficient string comparison algorithm is thus:
First compare the size of the two strings, if the sizes differ return false, otherwise
step through each element of the two strings in unison and compare until one differs or the end is reached, return the result.
Under spaceship operator rules we need to start with the deep comparison on each element first until we find the one that is different. In the our example of "foobar" and "foo" only when comparing 'b' to '\0' do you finally return false.
To combat this there was a paper, P1185R2 which details a way for the compiler to rewrite and generate operator== independently of the spaceship operator. Our IntWrapper could be written as follows:
Just one more step… however, there’s good news; you don’t actually need to write the code above, because simply writing auto operator<=>(const IntWrapper&) const = default is enough for the compiler to implicitly generate the separate—and more efficient—operator== for you!
The compiler applies a slightly altered “rewrite” rule specific to == and != wherein these operators are rewritten in terms of operator== and notoperator<=>. This means that != also benefits from the optimization, too.
Old Code Won’t Break
At this point you might be thinking, OK if the compiler is allowed to perform this operator rewriting business what happens when I try to outsmart the compiler:
struct IntWrapper {
  int value;
  constexpr IntWrapper(int value): value{value} { }
  auto operator<=>(const IntWrapper&) const = default;
  bool operator<(const IntWrapper& rhs) const { return value < rhs.value; }
};
constexpr bool is_lt(const IntWrapper& a, const IntWrapper& b) {
  return a < b;
}
The answer here is, you didn’t. The overload resolution model in C++ has this arena where all of the candidates do battle, and in this specific battle we have 3 candidates:
IntWrapper::operator<(const IntWrapper& a, const IntWrapper& b)
IntWrapper::operator<=>(const IntWrapper& a, const IntWrapper& b)
(rewritten)
IntWrapper::operator<=>(const IntWrapper& b, const IntWrapper& a)
(synthesized)
If we accepted the overload resolution rules in C++17 the result of that call would have been ambiguous, but the C++20 overload resolution rules were changed to allow the compiler to resolve this situation to the most logical overload.
There is a phase of overload resolution where the compiler must perform a series tiebreakers. In C++20, there is a new tiebreaker that states we must prefer overloads that are not rewritten or synthesized, this makes our overload IntWrapper::operator< the best candidate and resolves the ambiguity. This same machinery prevents synthesized candidates from stomping on regular rewritten expressions.
Closing Thoughts
The spaceship operator is a welcomed addition to C++ and it is one of the features that will simplify and help you to write less code, and, sometimes, less is more. So buckle up with C++20’s spaceship operator!
We urge you to go out and try the spaceship operator, it’s available right now in Visual Studio 2019 under /std:c++latest! As a note, the changes introduced through P1185R2 will be available in Visual Studio 2019 version 16.2. Please keep in mind that the spaceship operator is part of C++20 and is subject to some changes up until such a time that C++20 is finalized.
If you encounter other problems with MSVC in VS 2019 please let us know via the Report a Problem option, either from the installer or the Visual Studio IDE itself. For suggestions or bug reports, let us know through DevComm.
Visual Studio 2019 version 16.2 Preview 3 includes built-in Clang/LLVM support for MSBuild projects. In our last release, we announced support for Clang/LLVM for CMake. In the latest Preview of Visual Studio, we have extended that support to also include MSBuild projects. While in most cases we recommend using the MSVC compiler, we are committed to making Visual Studio one of the most comprehensive IDEs on Windows. You may want to use Clang instead if you are developing cross platform code, especially if it already depends on Clang or GCC extensions. You can now use Clang/LLVM to target both Windows and Linux using MSBuild just like you can with CMake projects. We’ve also updated our included version of Clang to 8.0.0. Please download the latest Preview to try it out and let us know how it works.
Installing the Clang Tools for Visual Studio
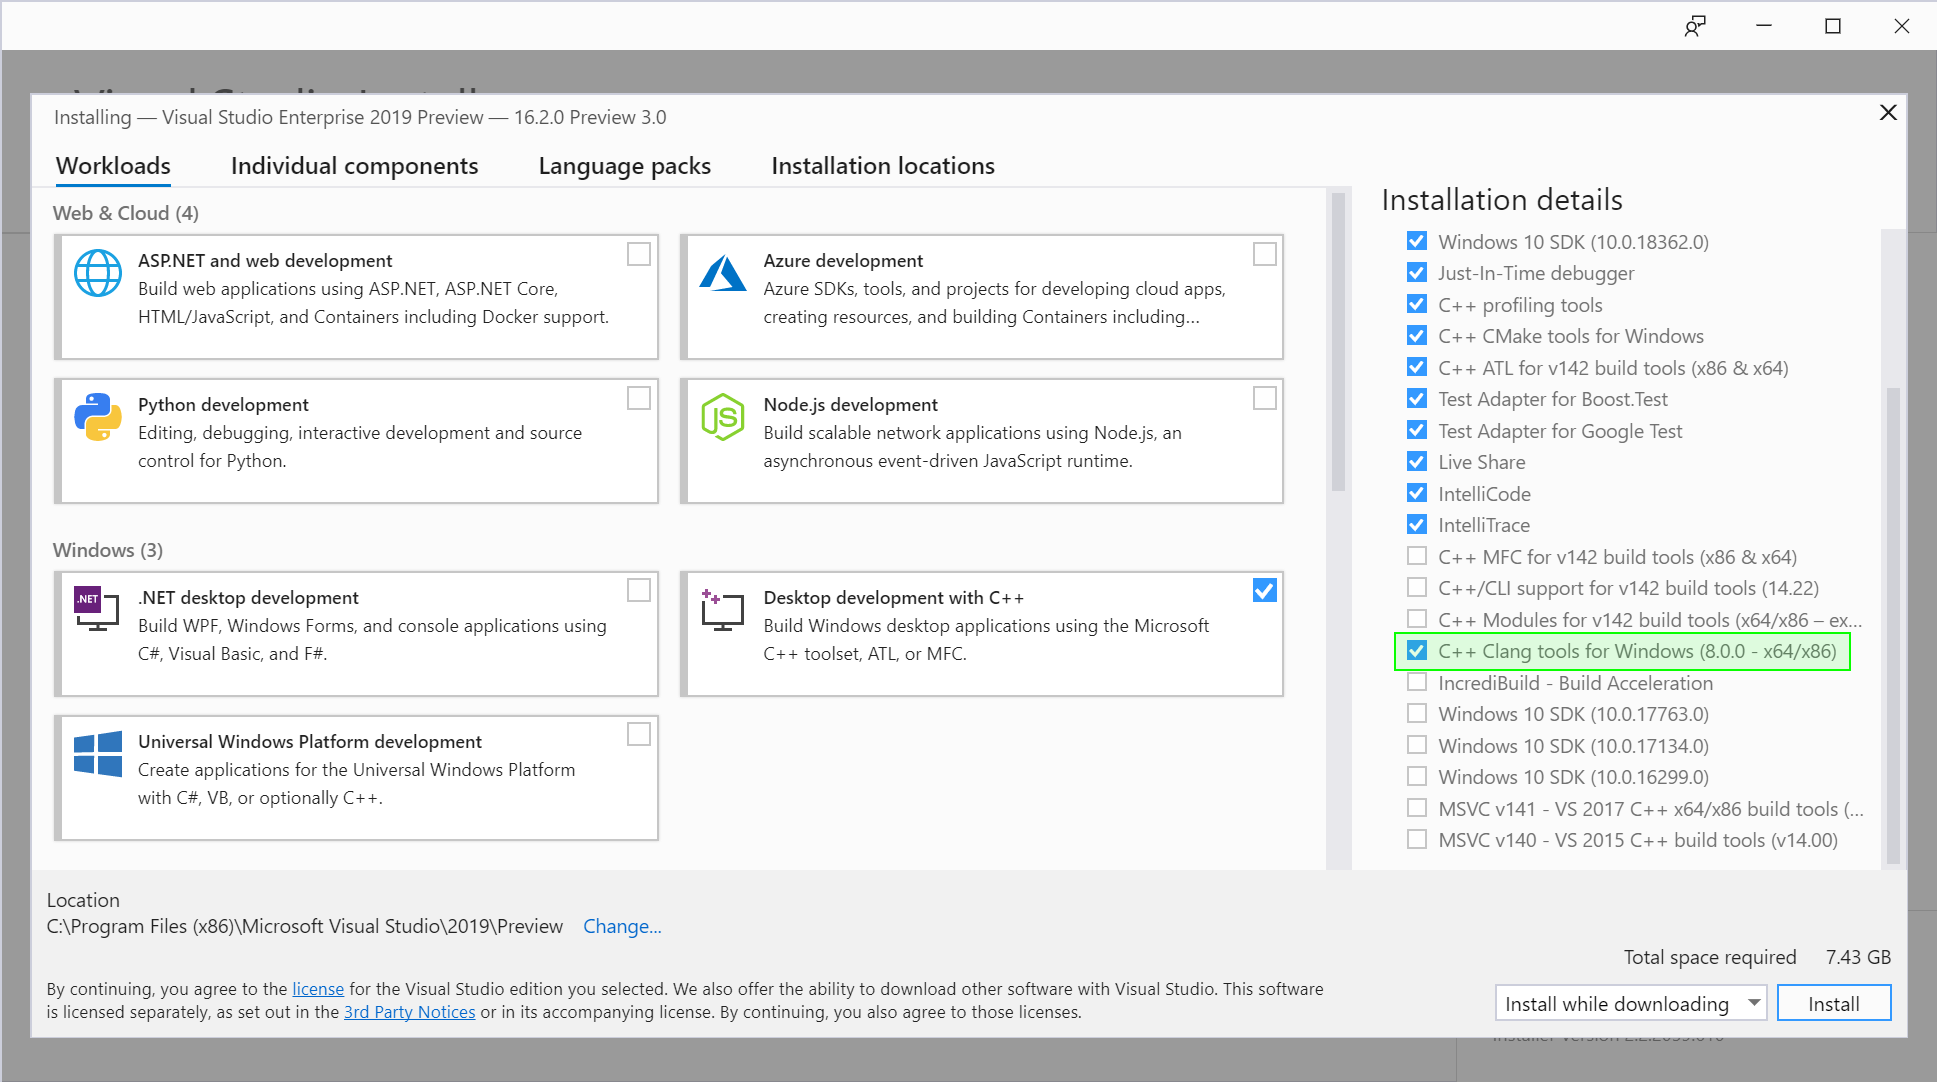
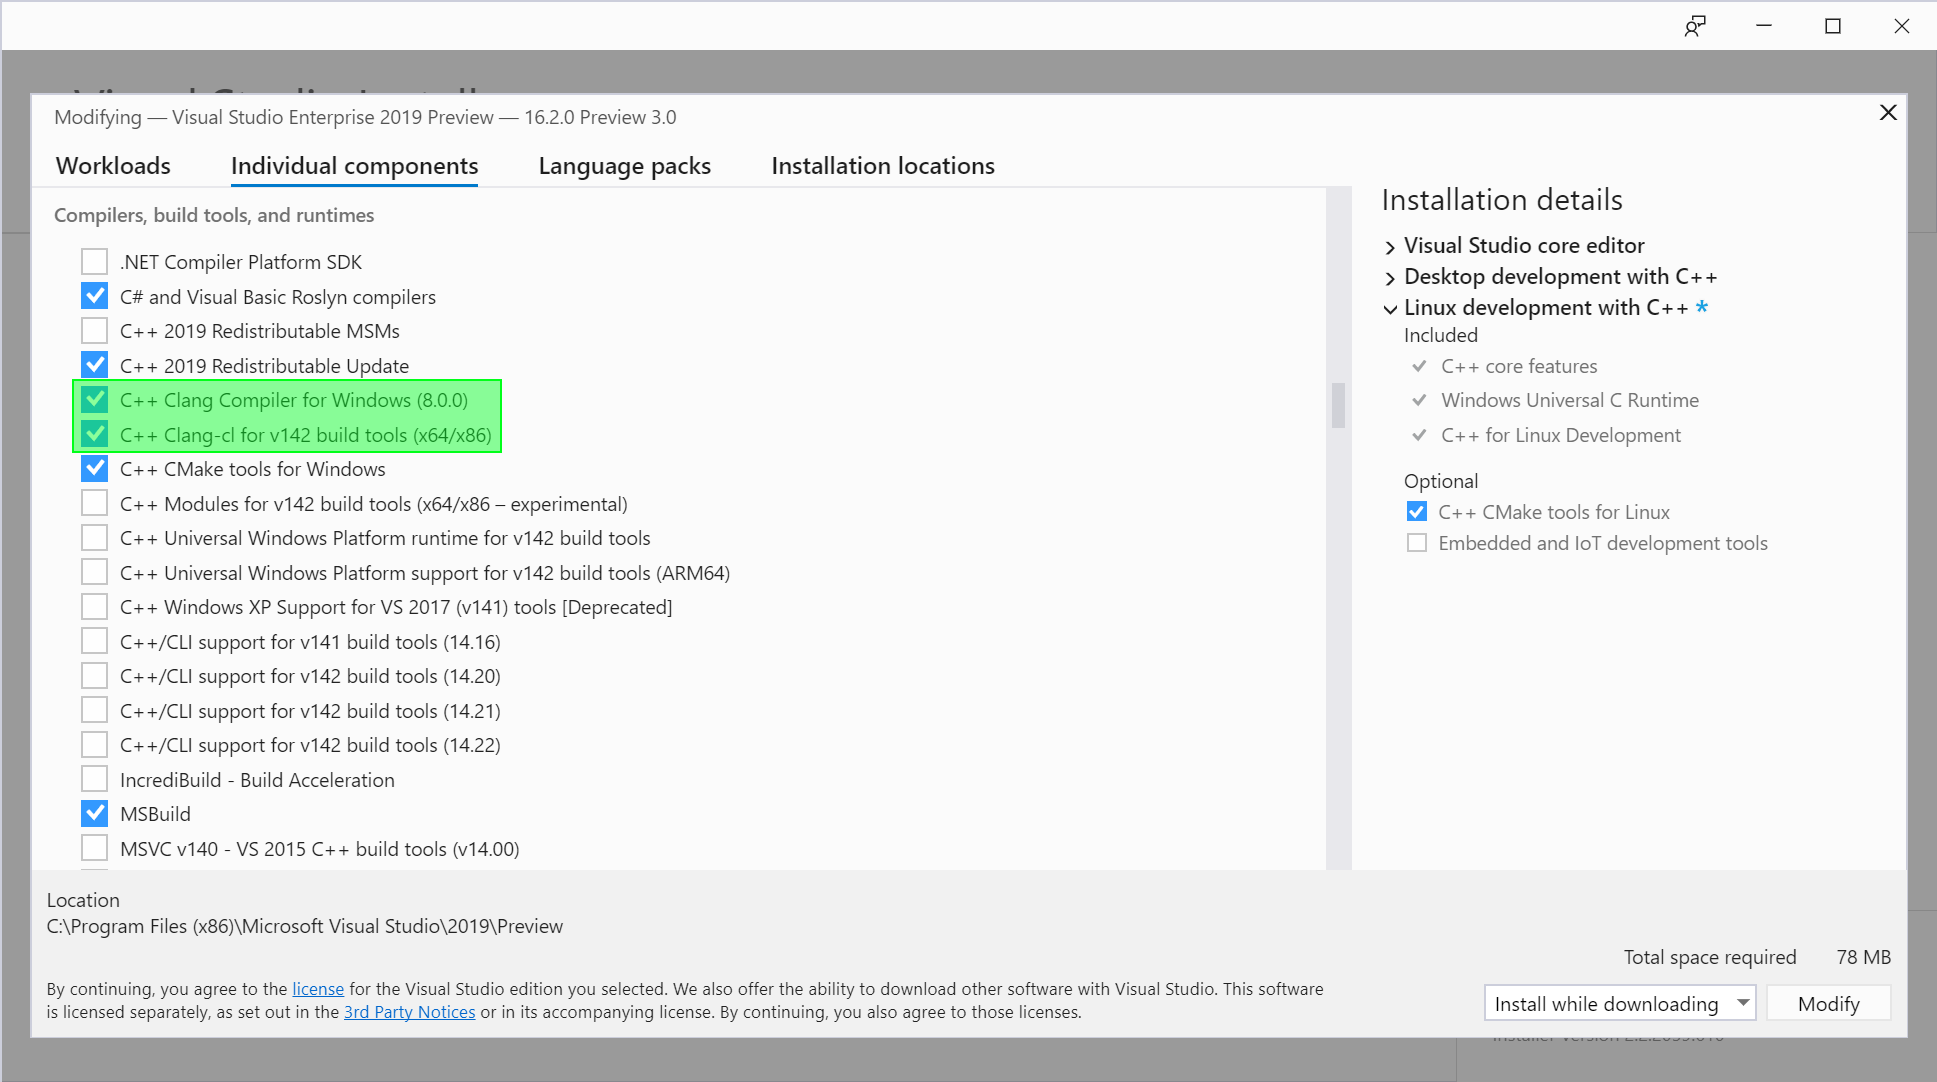
You can install the Clang tools for Windows by selecting “C++ Clang Tools for Windows” as part of the “Desktop development with C++” workload. It is not installed by default, but if you have installed it before, Clang will automatically be updated to 8.0.0 when you install the latest Preview.
If you want to use your own Clang compiler with Windows instead of the bundled one, you can do that too. Navigate to “Individual Components” and select “C++ Clang-cl for v142 build tools.” You will only be able to use recent versions of Clang (8.0.0 or later) with the Microsoft STL though. We strongly recommend using the bundled compiler as it will be kept up to date as the STL is updated.
To use Clang with Linux projects, just install the “Linux development” workload. You won’t need to select any more components. The remote machine or WSL will need to have Clang installed. Just install Clang from your distribution’s package manager or from LLVM’s download page.
Use Clang with Windows MSBuild Projects
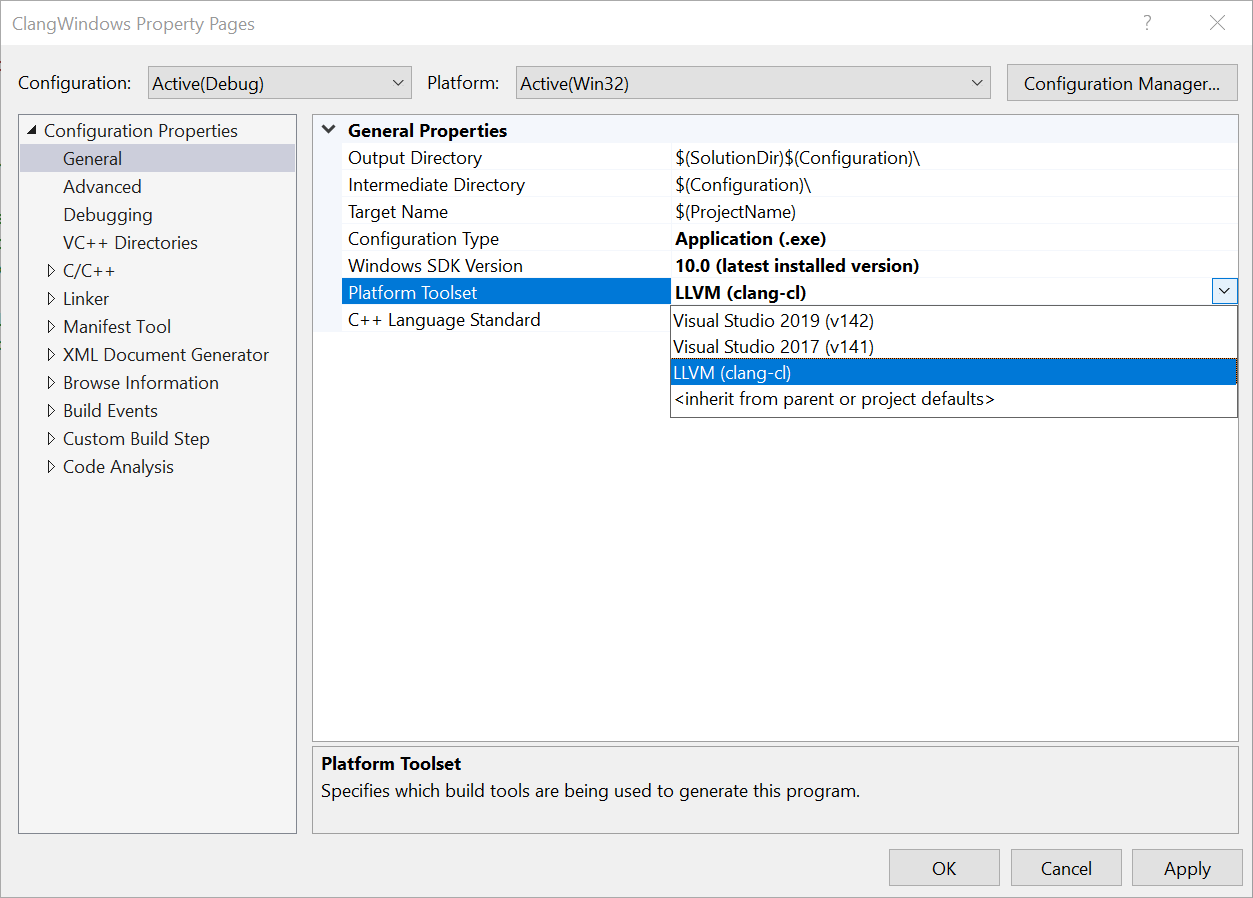
You can use Clang with most MSBuild projects that target Windows. To get started, create a new C++ project or open an existing one. Then, you can change the platform toolset to “LLVM (clang-cl)”:
If this toolset doesn’t appear, it likely isn’t installed – see above for installation instructions.
Visual Studio uses the clang-cl frontend with MSBuild on Windows so the properties for Clang will be the same as MSVC based projects. Some compiler options are not supported by clang-cl (e.g. Just My Code) and will be not be shown in the Property Pages when you are using Clang.
Use Clang with Linux MSBuild Projects
Using Clang with Linux projects is also as simple as selecting the appropriate platform toolset. For Linux projects, there are two toolsets to choose from. One for using Clang with a WSL instance on the local machine and another for using Clang on a remote machine:
For Linux projects, Visual Studio uses the Clang GCC-compatible frontend. The project properties and nearly all compiler flags are identical.
Custom Clang Installations and Compiler Arguments
You can also use a custom installation of Clang. On Windows, by default, the built-in version of Clang from the installer will always be used. On Linux, the first installation of Clang found on the PATH will be used. However, you can override this behavior on either platform by setting defining a property in your project file:
<LLVMInstallDir>PATH_TO_LLVM</LLVMInstallDir>
To do this, you will need to unload your project and edit it. You can add this to any project configurations that you would like to use your custom installation of Clang. Keep in mind, the Microsoft STL is only compatible with very recent versions of Clang: 8.0.0 as of this post.
If you need to use a Clang compile or link flag that isn’t supported by the project property pages, you can do that in the project properties under Configuration Properties > C/C++ or Linker > Command Line. Consider opening a feedback ticket if you find yourself using a particular option this way frequently. Based on demand, we may add it to the property pages.
Send us Feedback
Your feedback is a critical part of ensuring that we can deliver the best experience. We would love to know how Visual Studio 2019 version 16.2 Preview 3 is working for you. If you find any issues or have a suggestion, the best way to reach out to us is to Report a Problem.
The 2019.06 update of vcpkg, a tool that helps you manage C and C++ libraries on Windows, Linux, and MacOS, is now available. This is the first time we’ve created a vcpkg release on our GitHub repository. This update is designed to bring you a summary of the new functionality and improvements made to vcpkg over about a month’s time. The 2019.06 update covers the month of June.
This release includes many new ports and triplet updates including overlay options, improvements for port contributors, and new documentation. For a full list of this release’s improvements, check out our release notes on GitHub.
Ports
There has been a substantial growth in vcpkg contributions over the past few months, with over 1,000 packages now available in the catalog. You can view the libraries available by either searching for a library name in the GitHub repo ports folder or using the vcpkg search command.
We added 44 new ports in the month of June. Some notable additions include: bdwgc, cJSON, greatest, immer, json-c, and zydis. These ports have 1K+ stars on their respective GitHub repos. You can view a full list of new ports in the [new ports section of our release notes]().
In addition to new ports, we updated 291 existing ports. A notable update to the release includes port ‘Homepages’.
Port Homepages
As part of our infrastructure work, you can now view the ‘Homepage’ for a port. This allows you to easily view a port’s official homepage via a link to the website. Let’s take the Abseil port for example. If you navigate to <vcpkg root>/ports/abseil/CONTROL, you will find the line “Homepage: https://github.com/abseil/abseil-cpp” which links to the official Abseil page.
Overlay Ports
The vcpkg command line interface allows you to easily search, install, and maintain your libraries. We added an –-overlay-ports option to allow you to override ports with alternate versions and create private ports.
Let’s look at an example where you are using OpenCV for your computer vision project. You would like to use vcpkg to acquire OpenCV and other packages. Your team is specifically using version 3.0 of OpenCV, but vcpkg offers version 3.4.3. Even though that version of OpenCV is not available in vcpkg, you can create a private port.
Let’s say you go ahead and create a private GitHub repo and check in the ports you want to preserve including OpenCV 3.0 and its specific dependent libraries that also may not be available in current vcpkg. You can then provide your team with the link to clone your private repo.
Locally, you create a custom ports directory and commit your changes:
Note that you may need to update vcpkg to use the most up-to-date command line options. You can update vcpkg on Windows via .\bootstrap-vcpkg.bat or on macOS /Linux via ./bootstrap-vcpkg.sh.
This allows you to upgrade your packages and preserve the older version of OpenCV that your project requires.
As shown in the example above, you can use --overlay-ports with the vcpkg install, vcpkg update, vcpkg upgrade, vcpkg export, and vcpkg depend-info commands. Learn more in our overlay-ports documentation.
Note that while overlay ports can help with overriding port versions and creating private ports, this is part of our ongoing work to improve the usability of vcpkg when it comes to versioning. Stay tuned for a future post on best practices for versioning with vcpkg!
Triplets
Vcpkg provides many triplets (target environments) by default. This past month, we focused on increasing the number of ports available on Linux and creating port improvements for Linux and the Windows Subsystem for Linux (WSL). We now have 755 ports available for Linux and we updated over 150 ports for Linux and WSL.
Here is a current list of ports per triplet:
Triplet
Ports Available
x64-osx
823
x64-linux
755
x64-windows
1006
x86-windows
977
x64-windows-static
895
arm64-windows
654
x64-uwp
532
arm-uwp
504
Don’t see a triplet you’d like? You can easily add your own triplets. Details on adding triplets can be found in our documentation.
Overlay Triplets
As part of our vcpkg command line updates, we also added an --overlay-triplets option. This option is especially helpful if you have custom triplet needs. You can use the option, similar to --overlay-ports, to override triplets with custom specifications and create custom triplets.
For example, a subset of Linux users require fully dynamic libraries, whereas the x64-linux triplet only builds static libraries. A custom triplet file based on the x64-linux triplet can be created to build dynamic libraries. To solve this problem:
First, create a folder to contain your custom triplets:
We also made improvements to the vcpkg infrastructure including a public CI system, check features, and a ‘Homepage’ field for ports.
CI System
We now have public CI tests through Azure DevOps pipelines which are run for all PRs to the vcpkg GitHub repo. The CI system allows contributors to get direct, automatic access to failure logs for PRs on Linux, Windows, and Mac within minutes. For example:
The checks will still include badges to indicate pass/fail as shown by the ‘x’ or ‘check mark’.
And if a check fails, you can now drill into the details:
Going further into Azure DevOps, you can get more information in the Summary tab such as downloading a zip file of all the failure logs along with a quick description of relevant changes:
We hope the new CI system will improve your experience submitting PRs to vcpkg!
Check Features
Vcpkg_check_features is a new portfile function that checks if one or more features are a part of a package installation. In vcpkg we use features to enable optional capabilities offered by libraries. A user requests vcpkg to install. For example:
~/vcpkg$ vcpkg install opencv[cuda]
The install command enables the optional CUDA support for OpenCV.
Vcpkg_check_featuressimplifies the portfile creation process for vcpkg contributors by shortening the syntax needed in the CMake portfile script. Previously, you needed to specify which features are included in the port:
We also added an optional ‘Homepage’ field to CONTROL. This means that CONTROL files may now contain a ‘Homepage’ field which links to the port’s official website. The Homepage field is designed to help you more easily find the origin/location of the ports you are using.
Documentation
We also updated our documentation to reflect these new changes. Check out the following new docs for more information on some of the updates outlined in this post in addition to a couple other areas:
Thank you to everyone who created vcpkg! We now have 639 total contributors. This release, we’d like to thank the following 24 contributors who made code changes in June:
The July 2019 update of the Visual Studio Code C/C++ extension is now available. This release includes many new features, including semantic colorization and improvements to the IntelliSense Configuration Settings Editor UI and IntelliSense cache. For a full list of this release’s improvements, check out our release notes on GitHub.
Semantic Colorization
Semantic colorization support has been one of the top asks on our GitHub repo for the past few years. We faced many challenges in creating support for semantic colorization for the C/C++ extension since there is no VS Code API for semantic source highlighting and no support for semantic colorization in the VS Code language server protocol. We also can’t access a theme’s colors programmatically, so this support was even more challenging to make possible. Luckily, we were able to devise a way to overcome these challenges by managing our own set of tokens and their ranges, using TextEditorDecorations, and directly parsing theme files and VS Code settings to determine which colors to apply. With that, we are excited to share semantic colorization support!
Semantic colorization support provides colorization to tokens even when they are out of context, thus providing colorization beyond that of syntax. For example, if you use a variable name outside of the place in which the variable is declared, you will see colorization:
In the above example, we see our struct is now colorized when it is defined as ‘box’ and when it is used in our main function.
Themes
The colors can be mapped using the existing support for theming and color customization in VS Code. Documentation on Theming in VS Code can be found here. Colors are associated with TextMate scopes. You can read more about the C/C++ extension IntelliSense tokens and scopes in our colorization documentation.
Many of the tokens recognized by IntelliSense do not directly map to existing scopes in VS Code’s default C/C++ TextMate grammar, so those will not be colored by existing VS Code themes. You can customize your color settings in Visual Studio Code, however. There are two ways in which you can do this – via global settings or on a per-theme basis. Theme authors can also make use of these scopes when creating a new color theme.
Customize Colors in Global Setting
In your settings.json file you can customize the colors for all themes by overriding the tokenColorCustomizations setting:
The goal of the settings editor UI is to provide an alternative interface to the c_cpp_properties.json file for configuring IntelliSense for the C/C++ extension. The interface is simple and clear, and thus makes IntelliSense configuration easier to understand. Based on your feedback, we made a few improvements to the IntelliSense Configuration settings editor UI.
Select, Edit, and Add Configurations
There are a variety of reasons you may benefit from multiple IntelliSense configurations. For example, you may be using debug and release builds. In this case, having IntelliSense configured for debugging and release can improve your editing experience when switching between build types. To more easily get started with multiple configurations, we added an option to select the configuration you’d like to work with:
Further, you can edit the settings of the selected configuration:
Finally, you can add configurations via the settings editor UI:
List of Detected Compiler Paths
You can also now see a list of detected compiler paths in the UI under the “compiler path” dropdown text field.
We hope these improvements to the IntelliSense Configuration settings editor UI will help you more easily configure IntelliSense with the C/C++ extension.
IntelliSense Cache
We introduced IntelliSense Caching in the C/C++ extension March 2019 update. The purpose of it is to cache header information to improve IntelliSense speed. We received a lot of feedback on the default size for IntelliSense caching via an issue filed in our GitHub repo. After a productive conversation, we devised a proposal for changes to the default path. We have improved this feature in the July 2019 update.
The Default Path
Previously, the default path for the IntelliSense cache was in the “.vscode” folder of the project workspace (${workspaceFolder}/.vscode). Changing the default path enables us to address concerns of the cache on source control for the workspace folder. Furthermore, since the cache size limit is applied to a cache location, having one location reduces the overall disk space usage of the cache.
Now, the default for the C_Cpp.intelliSenseCachePath setting is “~/.vscode-cpptools” on Linux and macOS and “%LocalAppData%/Microsoft/vscode-cpptools” on Windows.
Note, the extension will automatically remove any caches previously added to the ${workspaceFolder}/.vscode folder if you were using the old IntelliSense cache path default.
We can be reached via the comments below or via email (visualcpp@microsoft.com). You can also find our team – and me – on Twitter (@VisualC or @tara_msft).
On the C++ team we’ve heard loud and clear from users that build times are a pain point. So we’ve continued our focus on improving the step, linking, that dominates F5 build times. Fast F5 build times, or iteration build times, are a key contributor to developer productivity and we felt that there was a large opportunity so we narrowed in on changes that we felt could move the needle 2x or more. This is on top of the significant improvements we made to the tool chain to speed up link times in the VS 2019 16.0 release. Let me give a teaser of the kinds of wins we were able to achieve.
This shows a 3.5X win in 16.2 vs. 15.9 for a /debug:full build of the release configuration of the UE4 infiltrator demo and a 1.6X win using /debug:fastlink. This is a middle of the road win given the other workloads we measured. The fastlink win in particular was a little weak. So what did we do? We went back to basics.
What did we do: Improved Fundamentals
Link.exe is responsible for combining a disparate and large set of data into the executable and PDB and is fundamentally a serial process (mostly). After our changes in VS2019 16.0 to reduce the size of the debug input, as well as improvements to our type hashing strategy, we went back to basics and improved our core data structure and algorithm implementations. With this change all our internal data structures have been updated to give better cache performance and memory utilization, as well as implement aggressive memoization of intermediate data to eliminate redundant computation. These changes are at the base of the linker and the entire C++ ecosystem and, happily, show wins across nearly all the scenarios we track. Do you use /debug:full? It’s faster. Do you use /debug:fastlink? It’s faster too. Additionally, recompile scenarios that use link /incremental also follow the trend and are faster as well.
A key objective with these changes, as with any changes we make to the MSVC toolset, was to maintain compatibility. All of the changes we made preserved interoperability so if you have an older library or PDB that is binary compatible with VS everything will continue to work.
Show me the numbers
One of our key outcomes we wanted from this effort was to improve iteration build times for our largest inputs. These typically are large dlls or exes that combine a large number of objs with static libs and other components. There are a lot of places where project sizes get big, but there were two main areas where we found good examples to analyze and improve.
Open Source Projects
There are several large OSS projects that we track for general correctness representative of long link times. For each of the workloads below we looked through the builds and found the link command that took the most time, and then created a link repro for it. To model the single obj rebuild and link time each of these link repros were then run in isolation. The times below are for each of the individual link repros and show the comparison between VS 2017 15.9 and VS 2019 16.2 Preview 2 “all up”. Note: the tables are split out into one for Debug time as well as one for Release with debug info time, also a description of /debug:fastlink is available on the VC blog.
These are the links to the source of the workloads we used in the above experiments.
Chrome (commit 2a88e68bd7498b185675098bcd0addf2c7b7808 ) * this is an older time stamp that still builds with MSVC.
Many AAA games are great examples of large monolithic exes, and because we worked closely with some of the game studios working on AAA titles for Xbox One we can show numbers – but with the names removed. “Beta” and “Charlie” are large games that showed long link times and are representative of large production C++ source bases. These were some of our most challenging linker inputs.
As you can see from the graph the improvements can scale with the size of the input. This can change depending on project specifics but we see this general trend across all the data.
Here’s the Summary
We did a major renovation and cleanup of the component that is the dominant part of the iteration build time. These changes show wins in the 2X range for /debug:fastlink and /incremental, while /debug:full is typically 3X-6X and up. (We’ve seen 10X wins on some workloads). These wins will show up in a wide variety of workloads and are fully compatible with other binaries produced by MSVC.
Is there any more?
Link times still dominate F5 and we’re still looking for ways to speed this up. At this point we think that a lot of the low hanging fruit is plucked so we are focusing on how the toolchain as a whole manages intermediate build products and debug info. So stay tuned for more.
Take it for a test drive
We’d love for you to download Visual Studio 2019 16.2 and give it a try. As always, we welcome your feedback. We can be reached via the comments below or via email (visualcpp@microsoft.com). If you encounter problems with Visual Studio or MSVC, or have a suggestion for us, please let us know through Help > Send Feedback > Report A Problem / Provide a Suggestion in the product, or via Developer Community. You can also find us on Twitter (@VisualC) and Facebook (msftvisualcpp).
My name is Terry Mahaffey and I work on the code generation team in MSVC. Lately I’ve been doing some work on our inliner and I wanted to give a brief introduction to our it before later diving into some of the changes we’ll be shipping.
Inlining is perhaps the most important optimization a compiler performs. In addition to removing call overhead, an inline decision is most useful when it exposes additional optimization opportunities not present in either the caller or callee by themselves. For example:
int bar(int x) {
    int y = 1;
    while(--x) {
        y = y * 2;
    }
    return y;
}

int foo() {
    return bar(5);
}
It is a really good idea to inline bar into foo in this example; once that is done the compiler is able to evaluate the entire function, and the final code generation of foo will directly return 16.
Contrast that with this example:
int bar(int x) {
    int y = 1;
    while(--x) {
        y = y * 2;
    }
    return y;
}

int foo(int x) {
    return bar(x);
}

int baz(int y) {
    return bar(y);
}

int zoo(int z) {
    return bar(z);
}
Here it is less clear that inlining bar into foo, baz, and zoo is a win. Because the parameter passed in is not constant, the compiler won’t be able to figure out the final value in each case at compile time. Inlining does avoid the call overhead, but that must be weighed against the fact that the body of bar will appear at least 4 times in the final program increasing code size and hurting cache locality.
The goal of a good inliner is therefore to estimate the “benefit” from inlining at a call site and weigh it against the “cost” (typically measured in code growth). In addition, in MSVC we have a notion of a global budget where we’ll stop inlining regardless of additional benefit to prevent code growth explosion.
In Visual Studio we have been working on expanding the capability of our inliner to both be smarter about what we inline (be able to realize there are benefits in places we didn’t before) and more aggressive (raising the inlining budget, lowering the threshold). We’ll have more to say in upcoming blog posts. But for now, I wanted to give some context to our inliner in MSVC and what makes it different from inliners in other compilers.
We inline pre-optimized code
In contrast to other compilers, when MSVC inlines a call it actually inlines pre-optimized code by reading in the original unoptimized version of the function for that callee again, even though the callee usually has been compiled and optimized by this point. This also means that it makes (and repeats) inline decisions in each context a function might be called in, perhaps leading to different results. For example, consider a function f which calls g which calls h, where h is inlined into g. If g is inlined into f, h will not necessarily be inlined into f as well. A compiler which inlines post-optimized code (here, a version of g which already has h inlined into it) implicitly “replay” inline decisions made for callees.
We feel this is a strength, as it might not necessarily be best to replay the same inline decisions in each context. However, this has a big compile-time cost as frequently the same inline decisions are made and the same code is optimized over again. We’re currently exploring a middle option where we can replay some of the obvious post-optimized versions of functions.
We inline first
Inlining is the first optimization done by the compiler. So not only is the compiler inlining pre-optimized versions of callees, it is also inlining into a pre-optimized version of the caller. One consequence is it currently doesn’t realize there are some obvious optimization opportunities. Revisiting the first example the compiler does great at realizing bar should be inlined into foo, but if foo were changed to look like this:
int bar(int x) {
    int y = 1;
    while(--x) {
        y = y * 2;
    }
    return y;
}

int foo() {
    int x = 5;
    return bar(x+1);
}
The MSVC inliner would currently consider “x+1” as a non-constant parameter, and not apply a bonus inside the inline heuristic based on the parameter usage in bar.
Another consequence is that indirect and virtual calls which could have been converted to direct calls via constant propagation haven’t been optimized to do so yet, so we do not inline through them. So frequently you’ll see an indirect call to a small function converted to a direct call and emitted in the final binary as such, leaving the programmer to wonder why the compiler missed such an obviously good inlining opportunity. It’s an ordering issue; sometimes the optimizer performs the optimizations the inliner needs after the inliner has already run.
These are also issues we’d like to address in the near future by performing a limited set of optimizations before or during inlining.
A word about our implementation
The MSVC inliner, at a high level, looks like this:
Identify all inline candidates (first set of legality checks)
For each candidate,
Read the body of the candidate, run a second series of legality checks
Run a series of inlining heuristics
If it looks like a good inline candidate, recursively inline into the candidate
Run a final series of legality checks
First, note that it is a “depth first” inliner. Moving towards a breadth first approach is an area that is on the roadmap to explore in the future. There are advantages and disadvantages to each approach.
These legality checks and heuristics are a set of tables of function pointers we iterate over. If any legality check fails, inlining is aborted for that candidate. If any heuristic check succeeds, inlining moves forward.
The three legality steps occur first based on only what we know about the potential inlinee before reading it in, second after it has read in the inlinee, and finally after we’re recursively expanded into the callee.
Legality checks tend to speak to limitations in the inliner, typically corner cases which were never implemented. Things like arguments with complex user types passed by value, inlining across different user defined parts of a binary, inlining functions with try blocks, inlining functions with setjmp, a inlining depth check where we have a hard limit on how deep we inline, etc.
The heuristics are not all created equal. There is one heuristic in particular called “callgraph decision” which is what I consider the “real” inline decision maker. It is where all of the benefit estimating code around constant parameters described above is implemented. A call graph decision depends on bottom up compilation order, because certain information is gathered about the callee during it’s compilation (such as its use of its parameters) which is then used during inlining. There are other simple heuristics such as the inlinee being a forceinline function, a very small function, and a “simple decision” heuristic for cases where a call graph decision can’t be made.
This framework is flexible and easy to understand. Adding a new legality check or heuristic is as simple as adding an entry into a table. Profile Guided Optimization, or PGO, utilizes its own inlining decision engine based on profiling data, and it implements this simply by having its own entry in the table. Similarly, for instrumented builds PGO prefers no inlining occur to help gather the most accurate set of counts possible. PGO implements turning off inlining for instrumented builds by a simple legality check which always says “no”.
If you want to see this in action, run your build with the /d2inlinestats switch. This will print out a table of what legality checks failed and how often, as well as what heuristics are driving the successful inline instances.
Conclusion
I hope you found this helpful. Over the next few months I plan on writing a few more blog posts to give some pointers on how to open up the hood even more and get more visibility into what specifically is happening with our inliner, as well as talk about features we have in development to address some of the problems. And if there are any inlining topics you’d like to see addressed, please leave a message in the comments below!
We’d love for you to download Visual Studio 2019 and give it a try. As always, we welcome your feedback. We can be reached via the comments below or via email (visualcpp@microsoft.com). If you encounter problems with Visual Studio or MSVC, or have a suggestion for us, please let us know through Help > Send Feedback > Report A Problem / Provide a Suggestion in the product, or via Developer Community. You can also find us on Twitter (@VisualC) and Facebook (msftvisualcpp).
In Visual Studio 2019 version 16.2 we continue to improve the C++ backend with build throughput improvements and new and improved optimizations. These build on top of our MSVC backend improvements in Visual Studio 2019 version 16.0 which we previously announced. We will be following up on many of the improvements here with their own blog posts.
Linker improvements speeding up iteration build times with debug info by 3x (or more) on large projects. (Numbers shown are for the Unreal Engine shipping configuration)
Link times also improved under /INCREMENTAL by 2x.
New and Improved Optimizations
Inliner Improvements
Small functions will be inlined more if it has a branch in it and is called from a branch in a loop.
Improved Code Generation and Optimization of Intrinsics
Removed the overhead of some common mathematical functions (
std::isnan
,
std::ldiv
,
std::lldiv
) by replacing the function calls with inline assembly instructions.
For x86/x64 targets the optimizer will recognize some vector intrinsics working only on the lowest element and do optimizations on them including building FMA (fused multiply-add) and doing constant folding.
Vectorizer Improvements
Tiny reduction loops (smaller than 12 iterations) will be vectorized for
/arch:AVX
and up if the elements perfectly fit the vector size.
Improved the code sequence generated for loops with a pointer induction variable when the auto vectorization attempt on these loops fails.
New Analysis Passes
Improved analysis of control flow to remove more complicated instances of branches that are provably true/false.
Added a new flow-sensitive restrict pointer analysis. A restrict pointer will be handled differently in regions where it can escape, i.e. be accessed outside of the current scope, than regions where it is safe to use as “restrict” pointer.
General Optimizer Improvements
Enable copy elision in functions where multiple objects are returned by value.
Improved optimization of pointer subtractions when using LTCG compilation. A pointer subtraction includes a division, which can now be optimized away in certain cases.
Improved optimizations to generate and simplify FMA instructions for x86/x64 platforms. This includes enabling FMA for global variables with vector type.
Improved code generation for C++20’s spaceship operator, which is available under
/std:c++latest
: better constant propagation of known values used in comparisons (e.g.
std::strong_ordering::less
), and compile-time computation of constant assembly instruction results.
Improved memset code generation by calling the faster CRT version where appropriate instead of expanding its definition inline. Loops that store a constant value that is formed of the same byte (e.g. 0xABABABAB) now also use the CRT version of memset.
Improved optimization to merge identical exception handling states, saving size for C++ programs. Note: This only works under FrameHandler4, which will become the default in Visual Studio 2019 version 16.3.
We’d love for you to download Visual Studio 2019 and give it a try. As always, we welcome your feedback. We can be reached via the comments below or via email (visualcpp@microsoft.com). If you encounter problems with Visual Studio or MSVC, or have a suggestion for us, please let us know through Help > Send Feedback > Report A Problem / Provide a Suggestion in the product, or via Developer Community. You can also find us on Twitter (@VisualC) and Facebook (msftvisualcpp).